

5.1 Imaging Overview
STIS can be used to obtain images in undispersed light in the optical and ultraviolet. When STIS is used in imaging mode, the appropriate clear or filtered aperture on the slit wheel is rotated into position, and a mirror on the Mode-Selection Mechanism is moved into position (see Figure 3.1:).
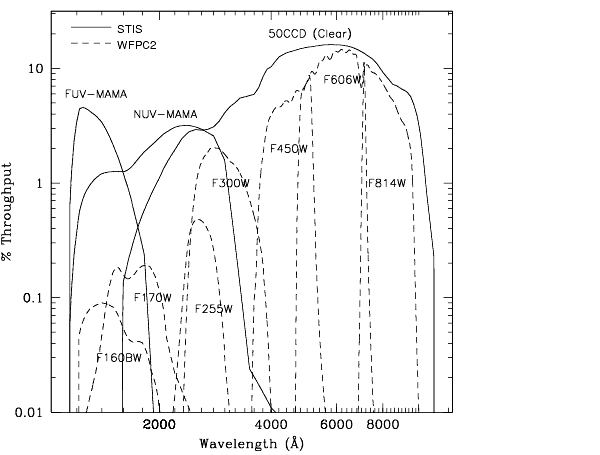
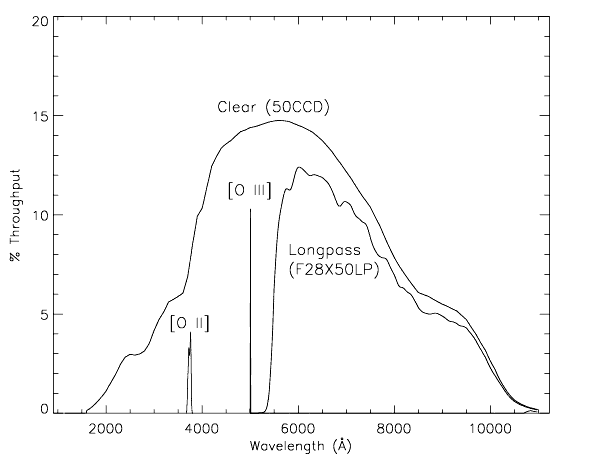
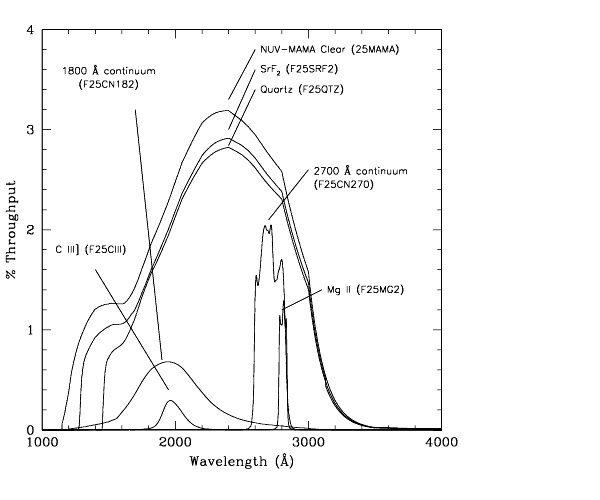
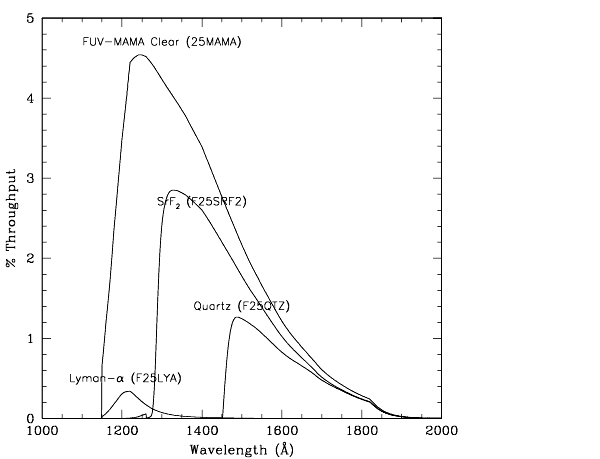
Table 5.1 provides a complete summary of the clear and filtered apertures available for imaging with each detector. In Figure 5.6 through Figure 5.9 we show the integrated system throughputs.
Table 5.1: STIS Imaging Capabilities
| Aperture Name |
Filter |
Central Wavelength (  c in Å) |
FWHM (   in Å) |
Field of View (arcsec) |
|
Detector |
ref. page |
Visible - plate scale per pixel
 |
| 50CCD
|
Clear |
5850 |
4410 |
52 x 52 |
|
STIS/CCD
|
|
| F28X50LP
|
Optical longpass |
7230 |
2720 |
|
|
STIS/CCD
|
|
| F28X50OIII
|
[O III] |
5007 |
5 |
|
|
STIS/CCD
|
|
| F28X50OII
|
[O II] |
3740 |
80 |
|
|
STIS/CCD
|
|
| 50CORON
|
Clear + coronagraphic fingers |
5850 |
4410 |
52 x 52 |
|
STIS/CCD
|
|
Ultraviolet - plate scale ~0.0246 arcseconds per pixel2 |
| 25MAMA
|
Clear |
2220 1370 |
1200 320 |
25 x 25 |
|
STIS/NUV-MAMA
STIS/FUV-MAMA
|
|
| F25QTZ
|
UV near longpass |
2320
1590 |
1010 220 |
25 x 25 |
|
STIS/NUV-MAMA
STIS/FUV-MAMA
|
|
| F25SRF2
|
UV far longpass |
2270
1480 |
1110 280 |
25 x 25 |
|
STIS/NUV-MAMA
STIS/FUV-MAMA
|
|
| F25MGII
|
Mg II |
2800 |
70 |
25 x 25 |
|
STIS/NUV-MAMA
|
|
| F25CN270
|
Continuum near 2700 Å |
2700 |
350 |
25 x 25 |
|
STIS/NUV-MAMA
|
|
| F25CIII
|
C III] |
1909 |
70 |
25 x 25 |
|
STIS/NUV-MAMA
|
|
| F25CN182
|
Continuum near 1800 Å |
1820 |
350 |
25 x 25 |
|
STIS/NUV-MAMA
|
|
| F25LYA
|
Lyman-  |
1216 |
85 |
25 x 25 |
|
STIS/FUV-MAMA
|
|
| Neutral-Density-Filtered Imaging |
| F25NDQ1
F25NDQ2
F25NDQ3
F25NDQ4
|
ND=10-1 ND=10-2 ND=10-3 ND=10-4 |
1150-10,300 Å |
13.4 x 9.7 13.8 x 15.1 11.4 x 15.3 11.8 x 9.5 |
|
STIS/NUV-MAMA
STIS/FUV-MAMA
STIS/CCD
|
|
| F25ND3
|
Neutral-density filter, ND=10-3 |
1150-10,300 Å |
25 x 25 |
|
STIS/NUV-MAMA
STIS/FUV-MAMA
STIS/CCD
|
|
| F25ND5
|
ND=10-5 |
1150-10,300 Å |
25 x 25 |
|
STIS/NUV-MAMA
STIS/FUV-MAMA
STIs/CCD
|
|
1The dimensions are 28 arcsec on AXIS2=Y and 52 arcsec on AXIS1=X. See Figure 3.2 and Figure 11.1:.
2The MAMA plate scales differ by about 1% in the AXIS1 and AXIS2 directions, a factor that must be taken into account when trying to add together rotated images. Also, the FUV-MAMA uses a different mirror in the filtered and unfiltered modes. In the filtered mode, the plate scale is 0.3% larger (more arcsec/pixel). Information on geometric distortions can be found in Chapter 14.
|
5.1.1 STIS versus ACS Imaging
The Advanced Camera for Surveys (ACS) was installed on HST during servicing mission SM3B in March of 2002, and has been performing very well since that time. Compared with STIS, ACS offers detectors with a much larger field of view, significantly higher throughputs at most wavelengths, a wider selection of filters, better suppression of point spread function (PSF) wings, and newer CCD detectors with far less accumulated radiation damage. Observers will therefore find that, especially at optical wavelengths, most imaging programs are better and more efficiently done with ACS than with STIS. There will, however, still be some cases where imaging with STIS is a better choice. The following points should be considered when choosing between STIS with ACS imaging:
- STIS does have a few filters that offer capabilities not duplicated by ACS. These include the narrow band STIS CCD
F28X50OII filter (3727 Å), and the STIS NUV-MAMA F25MGII (2800 Å) and F25CIII (1900 Å) filters. The NUV-MAMA intermediate band F25CN182 and F25CN270 filters may also prove useful for some programs.
- For very deep optical imaging, ACS WFC imaging with
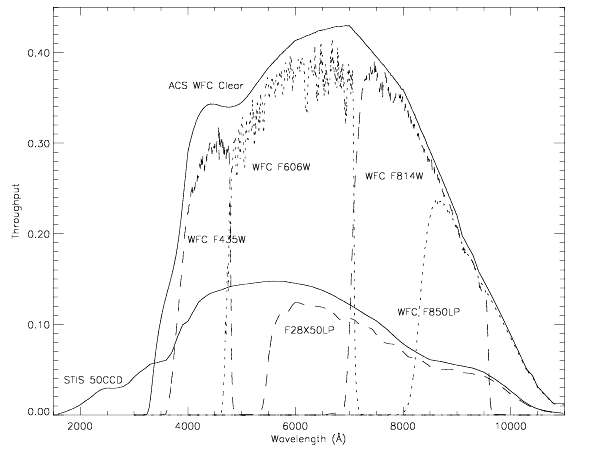
F606W or F814W will usually be a better choice than the STIS 50CCD or F28X50LP configurations (see Figure 5.1:).
- For many programs the ACS HRC with the
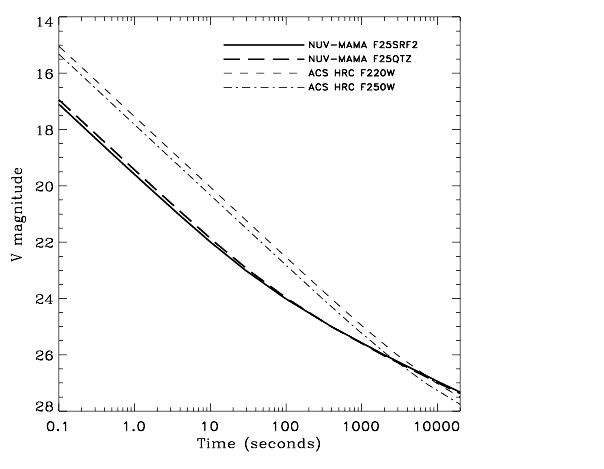
F220W or F250W filter should be considered as an alternative to broadband imaging with the STIS NUV-MAMA (see Figure 5.2 and Figure 5.3:). The NUV MAMA has no read noise, a very low red sensitivity (so that filter redleaks have very little impact), and a lower dark current (the MAMA's dark current advantage over the HRC should increase as the HRC CCD ages), while the HRC has a higher peak sensitivity and, unlike the NUV-MAMA detector, is not subject to bright object constraints. The NUV-MAMA does have a slightly smaller pixel size than the HRC, but the much cleaner PSF of the HRC will often offset this advantage when attempting to detect faint sources near bright objects. Furthermore, there is a significant focus change with position across the STIS NUV-MAMA (see Section 5.1.3). The final choice between the NUV-MAMA and the ACS HRC will depend on the details of each program's science requirements.
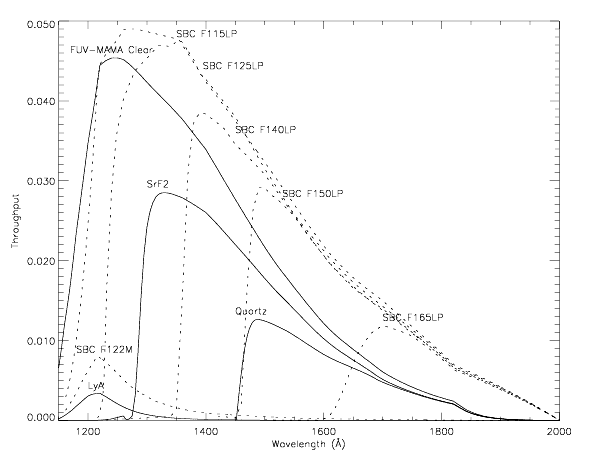
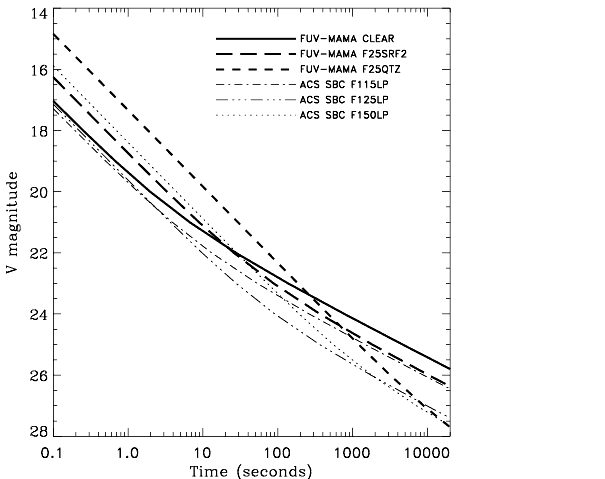
- The choice between the STIS FUV-MAMA and ACS SBC for far-ultraviolet imaging also largely depends on the details of the science requirements. ACS offers a larger variety of filters and better throughput at most wavelengths (see Figure 5.4 and Figure 5.5:). On the other hand, the STIS FUV-MAMA has better sampling of the PSF, thus providing higher spatial resolution. The STIS FUV-MAMA may also have a lower dark current (see Section 7.4.2). However, the on-orbit SBC dark current had not been measured at the time this documentation was prepared in June 2003, so users should check available updates.
- The STIS CCD coronagraphic aperture contains two occulting wedges and an occulting bar and is especially useful for detecting faint material surrounding a bright source. The wedges provide a wider choice of occulter sizes than do the ACS coronagraphic spots, and in some cases this may provide a better match for a particular target. See Section 12.10.
- The STIS MAMA detectors enable very high time resolution (
 ~125 microseconds) imaging in the ultraviolet, by means of
 TIME-TAG mode.
The ACS Instrument Handbook for Cycle 13 provides additional comparisons between the capabilities of STIS and ACS. Ultimately, observers should use the exposure time calculators for STIS and ACS to decide which of the two instruments is better suited for their science.
Figure 5.1: The total system throughputs of the STIS 50CCD and F28X50LP configurations are compared to the throughputs of several broad band ACS WFC filters.
Figure 5.2: The throughput of the NUV-MAMA with the 25MAMA, F25QTZ, and F25SRF2 apertures is compared with that of the ACS HRC F220W and F250W.
Figure 5.3: Exposure time required to reach S/N=10 versus the target V magnitude, for various STIS NUV-MAMA and ACS HRC filtered configurations, assuming an B1 V target spectrum The relative sensitivities of the various configurations will depend strongly on the shape of the target object's spectrum.
Figure 5.4: The throughputs of STIS FUV-MAMA configurations (solid lines) are compared with the filtered ACS SBC detector throughputs (dotted lines).
Figure 5.5: Exposure time required to reach S/N=10 versus the target's V magnitude, for various STIS FUV-MAMA and ACS SBC filtered configurations, assuming an B1 V target spectrum The relative sensitivities of the various configurations will depend very strongly on the shape of the target object's spectrum.
5.1.2 STIS vs. WFPC2 Imaging
While ACS has clear advantages over either STIS or WFPC2 for most prime GO imaging science, the great success of ACS also means that there will be ample opportunities for parallel observing with the other HST instruments. It is therefore still useful to compare the imaging capabilities of STIS and WPFC2.
- The STIS CCD detector, although it covers a much smaller field of view (51 x 51 arcsec) than WFPC2, has higher throughput over a much wider range of the spectrum (2000-11,000 Å). The STIS CCD also has a low read noise and dark current; thus STIS CCD observations with the clear
50CCD aperture have significantly higher sensitivity to faint sources than WFPC2 (figure 5.6 on page 63). The CCD long-pass imaging filter, F28X50LP, has similar sensitivity longward of 5500 Å. The STIS CCD also has a low read noise and dark current; thus STIS CCD observations with the clear or long-pass apertures are extremely sensitive to faint sources (see figure 5.6 on page 63). The STIS CCD clear imaging mode is especially useful when no color information is needed, for example, for finding faint variable sources, or imaging the faintest possible sources in a given integration time.
- The wings of the point-spread function in the STIS CCD imaging modes are suppressed by an internal Lyot stop. This feature provides a significant advantage for detecting faint sources near much brighter sources.
- The STIS FUV-MAMA detector enables true solar-blind imaging with high throughput from 1150 to 1700 Å with a considerably higher throughput than WFPC2. The NUV-MAMA is also relatively insensitive to red light and has also high relative throughput. Both provide near-critical sampling of the PSF (0.024 arcsecond per pixel).
- Remember that, because of the need to screen all MAMA observations for the presence of bright objects, the STIS MAMA detectors cannot be used for pure parallel observing, and can only be used for coordinated parallels when an exact orientation is specified.
- Charge Transfer Inefficiency (CTI) is larger for WFPC2 compared to the STIS CCD (1%).
Figure 5.6: STIS's Clear Imaging Throughputs Versus WFPC2
5.1.3 Caveats for STIS Imaging
There are several important points about imaging with STIS which should be kept in mind:
- The filters are housed in the slit wheel, and while they are displaced from the focal plane, they are not far out of focus. This location means that imperfections (e.g., scratches, pinholes, etc.) in the filters cause artifacts in the images. These features do not directly flat-field out because the projection of the focal plane on the detector shifts from image to image due to the nonrepeatability of the Mode Selection Mechanism's (MSM) placement of the mirror (careful post-processing may be able to account for registration errors).
- The quality of the low order flat fields for the MAMA imaging modes limits the photometric accuracy obtained over the full field of view (see Section 16.1).
- The focus varies across the field of view for imaging modes, with the optical performance degrading by ~30% at the edges of the field of view for MAMA imaging and less so for the CCD (see Section 14.7).
- STIS CCD imaging slightly undersamples the intrinsic PSF. The use of dithering (See Section 11.3) to fully sample the intrinsic spatial resolution and to cope with flat-field variations and other detector nonuniformities may be useful for many programs.
- Two of the STIS narrowband filters (
F28X50OIII and F25MGII) have substantial red leaks (see Figure 5.11 and Figure 5.16, respectively).
- The STIS CCD will have far more "hot" pixels and a much higher dark current than the newer ACS CCDs. Relative to WFPC2, a STIS CCD image will have a slightly larger proportion of the pixels affected by cosmic rays and "hot" dark current.
- Programs requiring high photometric precision at low count levels with the CCD should use
GAIN=1; programs at high count levels should use GAIN=4. At GAIN=4 the CCD exhibits a modest read-noise pattern that is correlated on scales of tens of pixels. (See Section 7.1.10.)
- At wavelengths longward of ~900 nm, internal scattering in the STIS CCD produces an extended PSF halo (see Section 7.3.4). Note that the ACS WFC CCDs have a front-side metallization that prevents a similar problem in that camera.
- The dark current in the MAMA detectors varies with time, and in the FUV- MAMA, it also varies strongly with position, although it is far lower overall than in the NUV-MAMA (see the discussion of Section 7.4.2).
- The repeller wire in the FUV-MAMA detector (see Section 7.3) leaves a 5-pixel-wide shadow that runs from approximately pixel 0,543 to 1024,563 in a slightly curved line. The exact position of the wire varies with the optical element used.
- The Charge Transfer Efficiency (CTE) of the STIS CCD is decreasing with time. The effects of the CTE decline are most serious for the lower rows of the detector and for faint sources with low background levels. For further details see Section 7.2.6.
These caveats are not intended to discourage observers from using STIS for imaging; indeed, for many imaging projects, particularly those not requiring a large field of view or the range of filters provided by WFPC2 and ACS, STIS may be the best choice.
5.1.4 Throughputs and Limiting Magnitudes
In Figure 5.6: above, we show the throughput (where the throughput is defined as the end-to-end effective area divided by the geometric area of a filled, unobstructed, 2.4 meter aperture) of the three STIS clear imaging modes, with the CCD, the NUV-MAMA, and the FUV-MAMA. Superposed on this plot, we show the broadband WFPC2 throughputs. In Figure 5.7, Figure 5.8, and Figure 5.9, we show the throughputs of the full set of available filters for the CCD, the NUV-MAMA, and the FUV-MAMA, respectively.
Figure 5.7: STIS's CCD Clear and Filtered Imaging Mode Throughputs
Figure 5.8: STIS's NUV-MAMA Clear and Filtered Imaging Mode Throughputs
Figure 5.9: STIS's FUV-MAMA Clear and Filtered Imaging Mode Throughputs
Limiting Magnitudes
In Table 5.2 below, we give the A0 V star V magnitude reached during a one-hour integration which produces a signal-to-noise ratio of 10 integrated over the number of pixels needed to encircle 80% of the PSF flux. The observations are assumed to take place in shadow, with average zodiacal background. These examples are for illustrative purposes only. Since sky background becomes important for the source count rates in Table 5.2, the exposure times will be much longer outside SHADOW. For instance, if a 27.7 mag A star were observed in Bright Earth, the exposure time to reach signal-to-noise=10 with CCD clear would be about 4 times longer.
Table 5.2: Limiting A Star V Magnitudes
| Detector |
Filter |
Magnitude |
Filter |
Magnitude |
| CCD |
Clear |
27.7 |
[O II] |
21.9 |
| CCD |
Longpass |
26.7 |
[O III]* |
21.2 |
| NUV-MAMA |
Clear |
24.1 |
|
|
| NUV-MAMA |
Longpass quartz |
24.1 |
Longpass SrF2 |
24.1 |
| NUV-MAMA |
C III] |
19.9 |
1800 Å continuum |
22.0 |
| NUV-MAMA |
Mg II* |
20.1 |
2700 Å continuum* |
22.0 |
| FUV-MAMA |
Clear |
21.5 |
Lyman-  |
16.8 |
| FUV-MAMA |
Longpass quartz |
22.3 |
Longpass SrF2 |
22.9 |
* These filters have substantial red leaks, (see [O III]-F28X50OIII, Mg II-F25MGII, and 2700 Å Continuum-F25CN270).
5.1.5 Signal-To-Noise Ratios
In Chapter 14 we present, for each imaging mode, plots of exposure time versus magnitude to achieve a desired signal-to-noise ratio. These plots, which are referenced in the individual imaging-mode sections below, are useful for getting an idea of the exposure time you need to accomplish your scientific objectives. More detailed estimates can be made either by using the sensitivities given in Chapter 14 or by using the STIS Imaging Exposure Time Calculator. The exposure time calculator is also available as part of the APT package.
5.1.6 Saturation
Both CCD and MAMA imaging observations are subject to saturation at high total accumulated counts per pixel: the CCD due to the depth of the full well and the saturation limit of the gain amplifier for CCDGAIN = 1; and the MAMA due to the 16-bit format of the buffer memory (see Section 7.2.1 and Section 7.4.1). In Chapter 14, saturation levels as functions of source magnitude and exposure time are presented in the S/N plots for each imaging mode.


Space Telescope Science Institute
http://www.stsci.edu
Voice: (410) 338-1082
help@stsci.edu
|
 c in Å)
 in Å)
in Å) per pixel


 ~125 microseconds) imaging in the ultraviolet, by means of