

The CCD imaging capability of STIS was designed primarily for target acquisitions, and therefore, only a small number of filters are available. Nevertheless, STIS CCD imaging has scientific utility of its own, due to the high throughput and relatively low read noise of the CCD detector. STIS CCD imaging can be obtained as prime pointings or in parallel with other instruments.
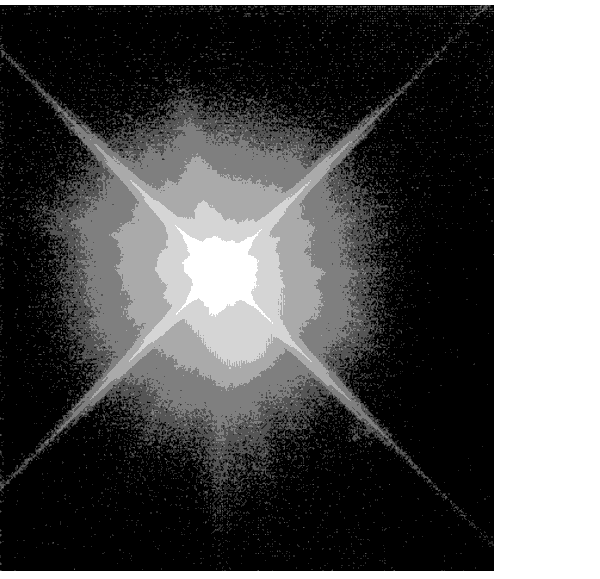
The optical performance of the CCD in imaging mode is good, and the plate scale of the CCD is 0.05073± 0.00008 arcsecond per pixel, providing a good compromise between sampling of the PSF and field of view. There is some degradation of the image quality towards the edge of the field. Observers can assume that 15 to 20% of the light from a point source falls in a single STIS CCD pixel and that ~80% of the light from a point source is contained within a 5 x 5 pixel region. An image of a typical point source is shown in Figure 5.10. See Chapter 14 for encircled energies at the field center for the different imaging modes and information on the field dependence of the PSF. For a discussion of the coronagraphic mask, see Section 12.10.
Figure 5.10: A co-added image of SAO 255271 taken using 50CCD shows the structure in the STIS PSF. This figure is plotted with a logarithmic intensity scale and is about 10" across. The ring seen below the center of the PSF is a ghost image. The position angle of this ghost varies as a function of location on the CCD (see Section 7.1.7 and Figure 7.4:).
The throughputs used for the CCD imaging modes are for the most part based on measurements of on-orbit calibration data and are accurate to within 5%.
The 50CCD aperture is a clear, unvignetted aperture which provides maximum sensitivity over the full 52x52 arcsecond field of view. The shape of the bandpass is governed by the detector, which has sensitivity from ~2000 to 10,300 Å. Figure 5.6: shows the throughput as a function of wavelength for this imaging mode (see also Chapter 14 for sensitivities, and signal-to-noise and saturation plots). If color information and a wide field of view are not required, then there is a clear advantage of this imaging mode over the WFPC2.
Figure 12.5: shows an example of a deep CCD image of a random field taken as part of the Archival Pure Parallel Program.
STIS's longpass filter cuts off at  < 5500 Å. It images a 28 x 52 arcsecond field of view. The
 F28X50LP filter is the principal target-acquisition aperture (see "Selecting the Imaging Aperture"). The integrated system throughput for this filter is given in Figure 5.7: (see also page 393 for sensitivities, and signal-to-noise and saturation plots).
The combination of 50CCD and F28X50LP can provide deep imaging with sufficient color information for some types of color-magnitude diagrams.
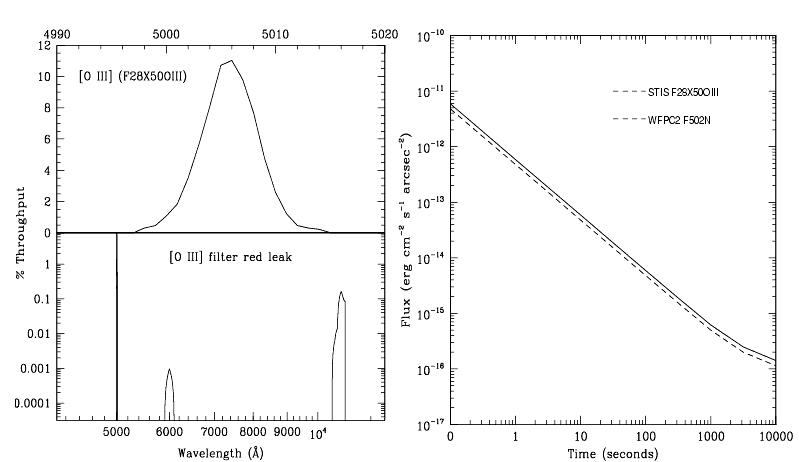
This filter images a 28 x 50 arcsecond field of view and can be used in target acquisitions or for direct imaging in the light of [O III]. The [O III] filter integrated system throughput and a signal-to-noise comparison with the WFPC2 [O III] filter are shown in Figure 5.11: (see also F28X50OIII-CCD for sensitivities, and signal-to-noise and saturation plots). The STIS [O III] filter is very narrow: only 5 Å wide, compared to the WFPC2 [O III] filter which is roughly 30 Å wide. The STIS [O III] filter has a substantial red leak that begins at 10,600 Å and continues to at least 12,000 Å. In the case of a very red star (K0 spectral type), the red leak will contribute approximately one third of the detected counts. The red leak for this filter is included in the passbands used by the STIS Exposure Time Calculator (ETC) and synphot. Observers are encouraged to use these tools to predict source and background count rates carefully.

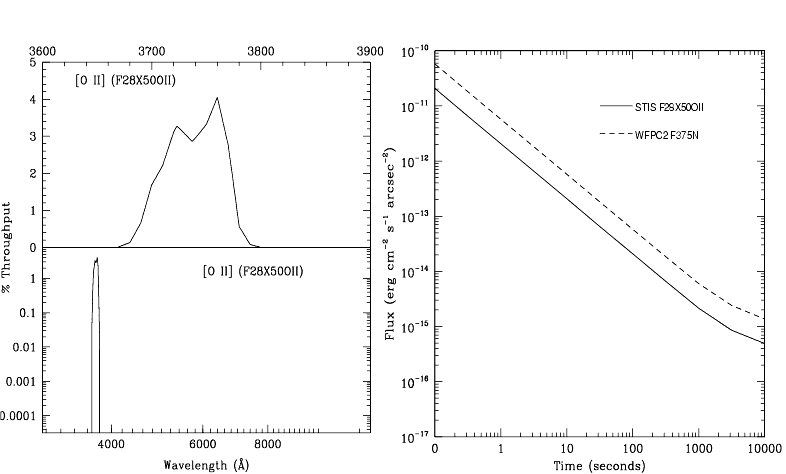
The [O II] filter images a 28 x 52 arcsecond field of view and can be used in target acquisitions or for direct imaging in the light of [O II]. The [O II] filter integrated system throughput and a signal-to-noise ratio comparison with WFPC2's [O II] filter are shown in Figure 5.12:. See page 399 for sensitivities, signal-to-noise and saturation plots.
Figure 5.12: F28X50OII: (a) Integrated System Throughput and (b) Flux vs. Exposure Time to achieve a signal-to-noise=5 compared to WFPC2 for a FWHM=1 Å line, integrated over an area of one square arcsecond. There is no substantial red leak in this filter.


|
Space Telescope Science Institute http://www.stsci.edu Voice: (410) 338-1082 help@stsci.edu |