Keep the accumulated counts per pixel below 65,536, by breaking single exposures into multiple exposures, as needed.


The MAMAs are photon-counting detectors: as each photon is recorded, it is placed into buffer memory. The STIS buffer memory stores values as 16-bit integers; hence the maximum number it can accommodate is 65,536 counts per pixel in a given ACCUM mode observation. When accumulated counts per pixel exceed this number, the values will wrap. As an example, if you are counting at 25 counts sec-1 pixel-1, you will reach the MAMA saturation limit in ~44 minutes.
Keep accumulated counts per pixel-1 below this value, by breaking individual exposures into multiple identical exposures (see also Section 11.2.4), each of which is short enough that fewer than 65,536 counts are accumulated per pixel. There is no read noise for MAMA observations, so no penalty is paid in lost signal-to-noise ratio when exposures are split. There is only a small overhead for each MAMA exposure ( Chapter 9).

|
Keep the accumulated counts per pixel below 65,536, by breaking single exposures into multiple exposures, as needed. |
The STIS MAMA detectors have intrinsically very low dark currents. Dark currents measured during ground testing were less than 10 counts/sec for the FUV-MAMA and less than 30 counts/sec for the NUV-MAMA over the whole detector. For the FUV-MAMA, this exceptionally low dark current was initially achieved on orbit. For the NUV-MAMA, charged particle impacts on the MgF2 faceplate cause a faint glow that results in a dark current of 800-2000 counts per second, varying both with temperature and the past thermal history of the detector. This particular glow is not present for the FUV-MAMA, but the dark current nevertheless varies with time and with position on the detector. The different dark-current behaviors of the detectors are discussed in more detail below, and up-to-date information can be found on the "Monitoring" page of the STIS web site.
Most of the dark-current in the NUV-MAMA comes from phosphorescence of impurities in the MgF2 detector faceplate. A simple model of the phenomenon has been developed by Jenkins and Kimble that envisions a population of impurity sites each having three levels: (1) a ground state, (2) an excited energy level which can decay immediately to the ground state, and (3) a metastable level that is at an energy slightly below the one that can emit radiation. The metastable state can be thermally excited to the upper level, and this excitation rate is proportional to e- E/kT, where
  E is the energy difference between the levels. The behavior of the count rate vs. temperature leads to an estimate of 1.1 eV for
  E. At a fixed detector temperature of 30° C, the time-constant for the dark current to reach an equilibrium value is about 8 days. In practice because the MAMA high-voltage power supplies have to be shut down during SAA impacted orbits, the detector temperature varies from about 27° C to 40° C, and the dark current never reaches equilibrium.
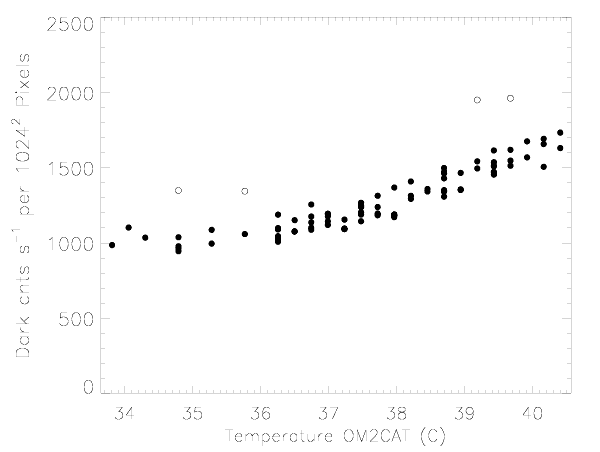
MAMA temperatures cycle on a roughly daily time scale, being lowest just after the high-voltage is turned on after a SAA passage. The dark current can be predicted with about 5 to 10% accuracy using the contemporaneous temperature of the NUV-MAMA charge amplifier recorded in the OM2CAT parameter in the raw file (_raw) that is part of the standard data products. Originally the NUV MAMA dark current was fit with the curve darkrate = 9.012x10²⁰ * exp (-12710 / T). This worked well for the first two years of STIS operations, but as the mean time-averaged temperature of the detector has increased, this formula has begun to predict too large a dark current. Recently, a new more flexible fitting formula has been implemented in the calstis package and the calibration pipeline. The prediction for the dark current now uses the formula darkrate = norm * 1.805x10²⁰ * exp (-12211.8 / max(T, Tmin)), where both norm and Tmin are slowly varying functions of time that are empirically adjusted to give a good match to the observed dark rate, and which are tabulated in the temperature dependent dark correction table (tdc) reference file.
The NUV-MAMA dark current measurements during the first four months of 2002 are shown in Figure 7.16:. The four open symbols in this figure represent measurements done immediately after SM3B, when the population of metastable states was far from equilibrium. Except for this interval, the NUV-MAMA dark rate early in 2002 varied between 9x10⁻⁴ and 1.7x10⁻³ counts/low-res-pixel/sec, with a mean rate of ~1.2x10⁻³ counts/low-res-pixel/sec. The mean OM2CAT during these observations was ~37.6° C. Updates will be provided to the user community should there be any significant changes in the behavior of the NUV-MAMA dark current.

Because 99% of the NUV-MAMA dark current is due to photons hitting the detector, it is appropriate to apply the flat-field prior to subtracting the dark current. The dark current varies slowly across the face of the detector, being about 1.25 times higher near the lower left corner (AXIS1, AXIS2 < 300) than at the center. This shape varies with time and temperature enough that subtraction of the scaled dark reference may leave a residual, spatially varying dark current. This is easiest to remove by fitting a low-order two-dimensional function to the background vs. pixel position.
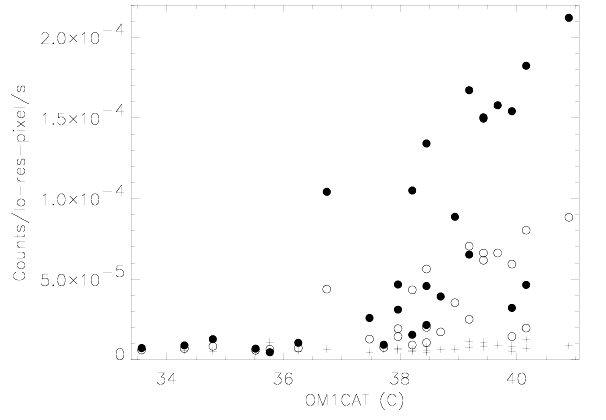
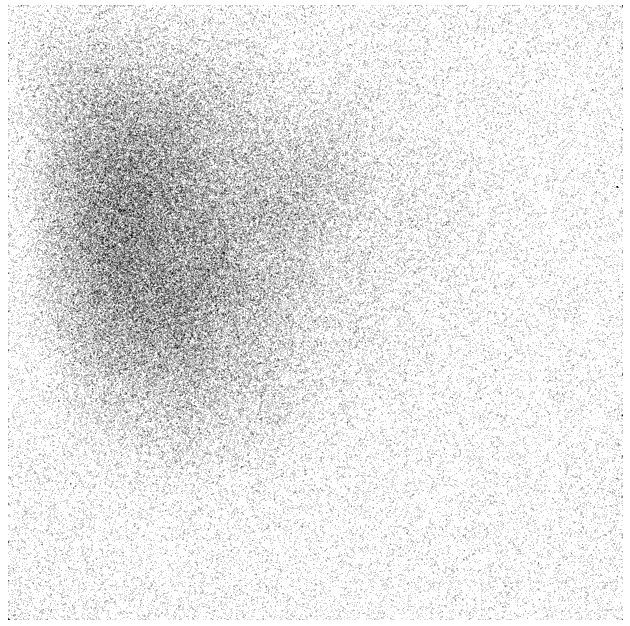
The FUV-MAMA dark current is substantially lower than that of the NUV-MAMA. Initially values as low as 7 counts/sec across the face of the detector (7 x 10⁻⁶ counts s-1 pix-1) could be routinely expected. However, there is also an intermittent temperature dependent glow that covers a large fraction of the detector (see Figure 7.18:). The source of the dark current is not phosphorescence but is intrinsic to the micro-channel plate array (it was seen in ground testing). This glow can substantially increase this current over a large fraction of the detector, and this leads to count rates of up to 100 counts/s integrated across the face of the detector. During the first two years of STIS operations, this glow was only present intermittently, but since mid-1999 it has been present more often than not (see Figure 7.17:). The FUV-MAMA glow as a function of temperature is much less predictable than the NUV-MAMA dark current, and in the future it may be higher due to the increased instrument temperature. We currently expect that count rates in the glow region to have a typical value of ~1.5x10⁻⁴ cts/low-res-pixel/s during Cycle 13.
Figure 7.17: FUV Dark Current vs. OM1CAT temperature between Jan. 1 and May 2, 2002. Filled symbols show the measured dark rate in the glow region (pixels [200:400,600:800]), open symbols show the average rate over the entire detector, and the + symbols show the dark rate in the lower right corner of the detector, where the glow is faintest.
An example of the dark current variation across the detector can be seen in Figure 7.18:, which is the sum of a number of 1380-second dark frames taken during periods of high dark current. The dark current in the lower right quadrant (pixels [900:1000,10:110] in IRAF notation) appears to be stable to within 10% over time. The dark current in the upper left quadrant (pixels [200:400,600:800]) varies with time and temperature. The total dark current can be approximated by the sum of a constant dark current plus a "glow" image, scaled to the net rate in the upper left quadrant. Dark current for the FUV-MAMA is not currently subtracted by the pipeline. However, the "glow" image is available from the STIS world-wide web site, at
http://www.stsci.edu/hst/stis/performance/background/
and can be used for off-line reduction. Revised information on the FUV-MAMA glow, suitable for off-line reduction, will be posted on the STIS web site as it becomes available.
Figure 7.18: Dark Current Variation Across Detector. The region in the upper left quadrant has the higher dark current.
Because the dark current is so low in the MAMA detectors, a typical STIS FUV-MAMA observation will have less than one count per pixel from the dark. It is good to keep this in mind when reducing the data, as various standard measures of background (the median for example) are not good estimates when the data are quantized into just a few values. The best way to estimate the background is to identify hot pixels using the standard reference files, then use an unclipped mean for the remaining pixels in a source-free region of the image.
MAMA detectors are capable of delivering signal-to-noise ratios of the order of 100:1 per spectral resolution element (2 x 2 pixels) or even higher. Tests in orbit have demonstrated that such high S/N is possible with STIS (Kaiser et al., 1998, Proc. SPIE, 3356, 415; Gilliland, STIS ISR 98-16.)
High S/N observations of several standard stars were obtained during STIS commissioning, and they were reduced with flats obtained during preflight testing of the detectors. Signal-to-noise ratios of 125 and 150 per spectral resolution element (for an 11 pixel extraction height in the cross dispersion direction) were achieved for the FUV- and NUV-MAMA observations, respectively; see Chapter 12 for a more detailed discussion.
For targets observed at a fixed position on the detector, the signal-to-noise ratio is limited by systematic uncertainties in the small-scale spatial and spectral response of the detector. The MAMA flats show a fixed pattern that is a combination of several effects including beating between the MCP array and the anode pixel array, variations in the charge-cloud structure at the anode, and low-level capacitive cross-coupling between the fine anode elements. Intrinsic pixel-to-pixel variations are 3.9% and 2.8% rms for the FUV- and NUV-MAMA, respectively, in 1024 x 1024 pixel format. In the highres 2048 x 2048 format (see Chapter 11) the intrinsic variations are much larger. This fixed pattern appears to be stable at the 1-2% level. The structure of the flat may vary slightly for different modes due to different incidence angles of the incoming photons on the microchannel-plate pores.
Observing strategies for achieving spectral S/N higher than ~50:1 are discussed in Chapter 12. For echelle-mode spectra, observers may want to consider the use of the FP-SPLIT slits; for first-order mode observations, they may wish to dither the target along the slit.
Since MAMA observations can be binned in post-observation data processing with no additional signal-to-noise price, the option to obtain MAMA observations with unequal binning (e.g. BINAXIS1=1, BINAXIS2=2) were disabled starting in Cycle 8.
The MAMA detectors begin to experience non-linearity (photon impact rate not equal to photon count rate) at global (across the entire detector) count rates of 200,000 counts sec-1. The non-linearity reaches 10% at 300,000 counts sec-1 and can be approximately corrected in post-observation data processing. Additionally, the MAMA detectors plus processing software are not able to count reliably at rates exceeding 285,000 count sec-1. For this reason and to protect the detectors, observations beyond this rate are not allowed (see Section 7.6, below).
The MAMA detectors remain linear to better than 1% in their counting up to ~22 counts sec-1 pixel-1 for the FUV-MAMA and 34 counts sec-1 pixel-1 for the NUV-MAMA. At higher rates, they experience local (at a given pixel) non-linearity. The non-linearity effect is image dependent-that is, the non-linearity observed at a given pixel depends on the photon rate affecting neighboring pixels. This property makes it impossible to correct reliably for the local non-linearity in post-observation data processing. In addition, the MAMA detectors are subject to damage at high local count rates (see Section 7.6).


|
Space Telescope Science Institute http://www.stsci.edu Voice: (410) 338-1082 help@stsci.edu |