

The F25MGII filter with the NUV-MAMA provides narrow-band imaging centered on the 2798 Å MgII feature.
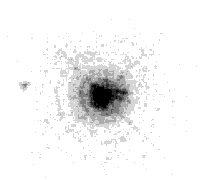
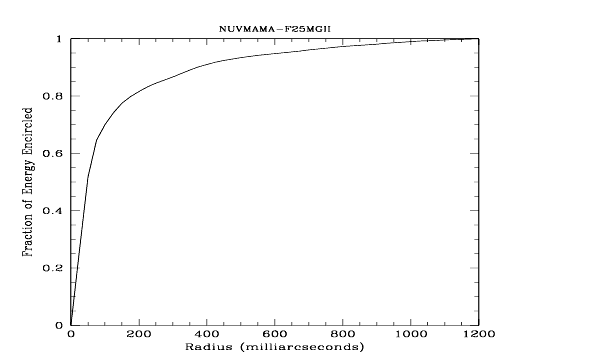
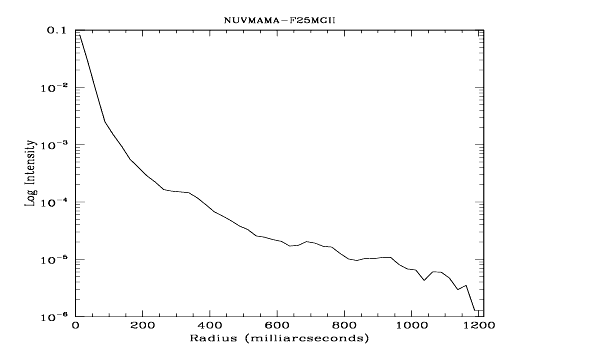
There is a substantial redleak in this filter. Sources with a red underlying continuum may be difficult to observe. Users should be careful to take into account the underlying continuum in estimating whether the observation will fall within the bright-object protection limits. This filter also has a complex PSF and exhibits several ghosts.
Figure 14.44: Point Source PSF for F25MGII NUV-MAMA 7."5 square (at pixel 316,658, log scaled, B-V=-0.04). Note psf ghost ~45 pixels left of peak pixel and a few 10-3 of the peak, as well as the much more complex ghost about 10 pixels to the right of the central pixel.
| Pivot  (Å) (Å) |
FWHM (Å) |
AB mag zeropoint |
Speak |
B  |
R80 (arcsec) |
Flux in central pixel |
|---|---|---|---|---|---|---|
| 2801.7 |
48.0 |
19.510 |
8.22+13 |
55.9 |
0.18 |
14% |
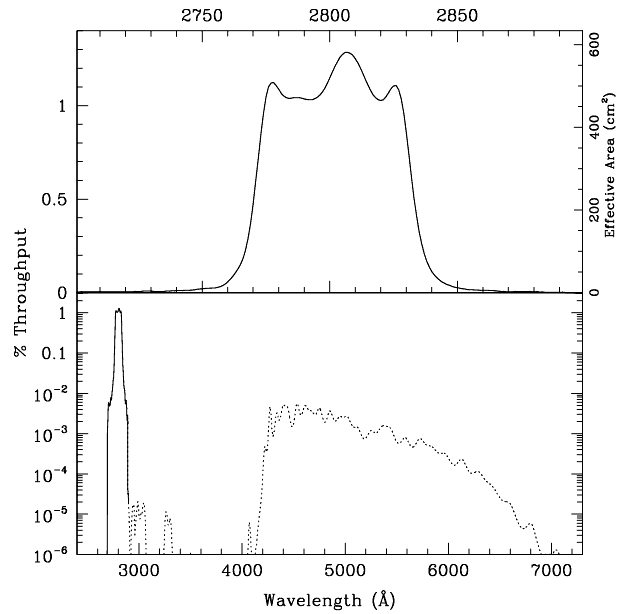
 for the F25MGII NUV-MAMA mode. Curves are labeled by required exposure time (sec).
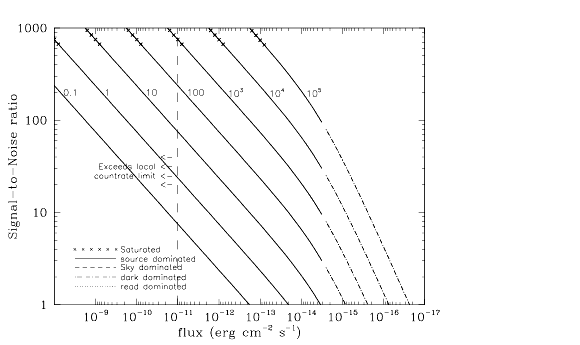
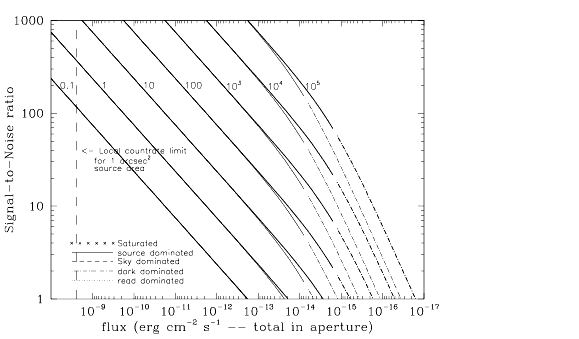
 for the F25MGII NUV-MAMA mode. Top curves are for an area of 0.2 arcsec2; bottom curves are for 1 arcsec2. Average sky assumed. Curves are labeled by required exposure time (sec).


|
Space Telescope Science Institute http://www.stsci.edu Voice: (410) 338-1082 help@stsci.edu |