|
| Cosmic Origins Spectrograph Instrument Handbook for Cycle 17 | ||||
|
|
10.3 Detector and Sky Backgrounds
When calculating expected signal-to-noise ratios or exposure times, the background from the detector must be taken into account. The detector background is quite small, as discussed in the next section.
The sources of sky background which will affect COS observations include:
The ETC allows the user to select among several levels of intensity for each of these backgrounds, corresponding to different observing environments.
10.3.1 Detector dark background
The following lists the dark current and read noise characteristics of the COS detectors:
Table 10.1: Detector background count rates for COS
Table 8:Detector: FUV XDL NUV MAMA Dark rate
(counts sec-1)0.5 per cm2
7.5 × 10⁻⁷ per pixel
4.5 × 10⁻⁵ per resel34 per cm2
2.1 × 10⁻⁴ per pixel
1.9 × 10⁻³ per reselRead noise 0 0
Note that, due to its windowless design, the dark current in the FUV detector is truly small, about 1 count resel-1 in six hours. It is the "resel," or resolution element, that matters most since that is the net "unit" for a spectrum.
10.3.2 Earthshine
The Earthshine surface brightness corresponding to the "high" level is shown in Figure 5.1xxx. There are four intensity levels to choose from in the ETC, with the following relative scaling factors:
(shadow, average, high, extremely high) = (0.0, 0.5, 1.0, 2.0).
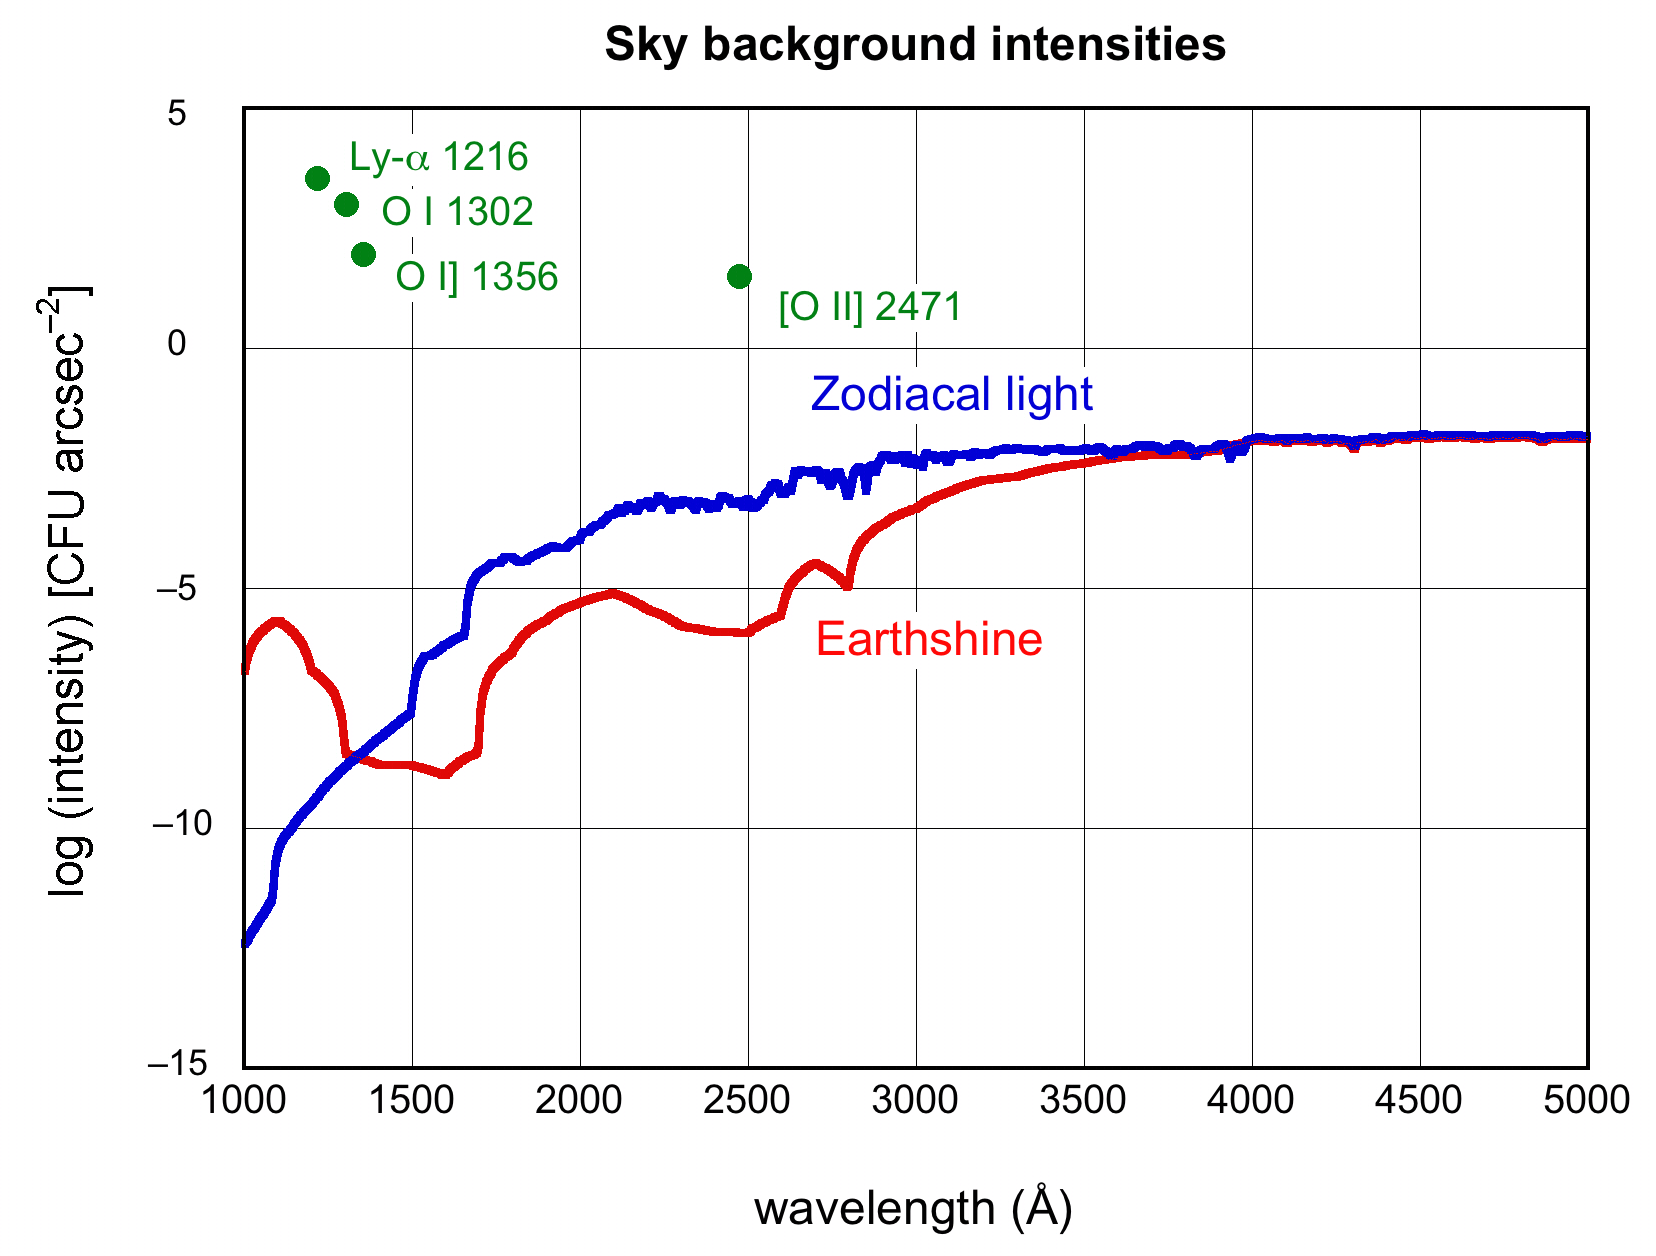
Figure 10.1: Sky background intensity as a function of wavelength.
The Earthshine is for a target which is 24 degrees from the limb of the sunlit Earth. Use Figure 5.2xx to estimate background contributions at other angles. The Zodiacal contribution corresponds to a helio-ecliptic latitude and longitude of 30º and 180º, respectively, which corresponds to mV = 22.7 per square arcsec. The upper limit to the [OII] 2471 intensity is shown. Note that the geocoronal day glow line intensities are integrated fluxes, in units of 10-15 erg cm-2 sec-1 arcsec-2.
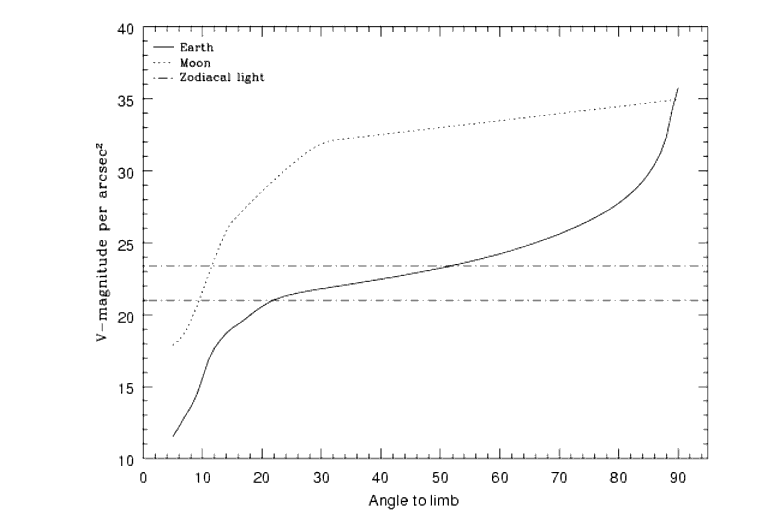
Earthshine varies strongly depending on the angle between the target and the bright Earth limb. The variation of the Earthshine as a function of limb angle from the sunlit Earth is shown in Figure 10.2. The figure also shows the contribution of the Moon which is typically much smaller, and the full range of the zodiacal contribution. In Figure 10.2, limits on the Zodiacal light contribution are also given. For reference, the limb angle is approximately 24° when the HST is aligned toward its orbit pole (i.e., the center of the CVZ). The Earthshine contribution given in Table and Figure 10.1 corresponds to this position.
Figure 10.2: Background contributions from the Moon and Earth.
The values are V magnitude per square arcsec due to the moon and the sunlit Earth as a function of angle between the target and the limb of the Earth or moon.
10.3.3 Zodiacal light
Away from the air glow lines, at wavelengths between about 1300 and 3000 Ĺ, the background is dominated by Zodiacal light, and is generally lower than the intrinsic detector background, especially for the NUV detector. Figure 10.1 shows the Zodiacal light for the "average" level in the ETC. The selectable levels and the factors by which they are scaled from this are:
(low, average, high) = (0.576, 1.0, 1.738).
The contribution of Zodiacal light does not vary dramatically with time, and varies by only a factor of about three throughout most of the sky. For a target near ecliptic coordinates of (50,0) or (-50,0), the zodiacal light is relatively bright at mV = 20.9, i.e. about 9 times the faintest values of mV = 23.3.
Observations of the faintest objects may need the special requirement LOW-SKY in the Phase II observing program. LOW-SKY observations are scheduled during the part of the year when the Zodiacal background light is no more than 30% greater than the minimum possible Zodiacal light for the given sky position. LOW-SKY in the Phase II scheduling also invokes the restriction that exposures will be taken only at angles greater than 40 degrees from the bright Earth limb to minimize Earthshine and the UV airglow lines. The LOW-SKY special requirement limits the times at which targets within 60 degrees of the ecliptic plane will schedule, and limits visibility to about 48 minutes per orbit.
The ETC provides the user with the flexibility to separately adjust both the Zodiacal (low, average, high) and Earthshine (shadow, average, high, extremely high) sky background components in order to determine if planning for use of LOW-SKY is advisable for a given program. However, the absolute sky levels that can be specified in the ETC may not be achievable for a given target; e.g., as shown in Table the Zodiacal background minimum for an ecliptic target is mV = 22.4, which is still brighter than both the low and average options with the ETC. By contrast, a target near the ecliptic pole would always have a Zodiacal = low background in the ETC. The user is cautioned to carefully consider sky levels as the backgrounds obtained in HST observations can cover significant ranges.
10.3.4 Geocoronal airglow emission
In the ultraviolet, the sky background contains important contributions from airglow lines. These vary from day to night and as a function of HST orbital position. The airglow lines may be an important consideration for spectroscopic observations at wavelengths near the lines, and may be quite important for NUV imaging observations.
Background due to geocoronal emission originates mainly from hydrogen and oxygen atoms in the exosphere of the Earth. The emission is concentrated in a very few lines. The brightest line by far is Lyman-
at 1216 Ĺ. The strength of the Lyman-
steradians) depending on the time of the observation and the position of the target relative to the Sun. The next strongest line is the O i line at 1304 Ĺ, which rarely exceeds 10% of Lyman-
It is possible to request that exposures be taken when HST is in the umbral shadow of the earth to minimize geocoronal emission (e.g., if you are observing weak lines at 1216 Ĺ or 1304 Ĺ) using the special requirement SHADOW. Exposures using this special requirement are limited to roughly 25 minutes per orbit, exclusive of the guide-star acquisition (or reacquisition) and can be scheduled only during a small percentage of the year. SHADOW reduces the contribution from the geocoronal emission lines by roughly a factor of ten, while the continuum earthshine is set to 0. If you require SHADOW, you should request it in your Phase I proposal (see the Call for Proposals).
An alternate strategy for reducing the effects of geocoronal emissions is to use time resolved observations, so that any data badly affected by geocoronal emission can simply be excluded from the final co-addition. This can be done either by doing the observations in TIME-TAG mode, the default for all COS observations if the target is not too bright, or by just taking a series of short (~ 5 min) ACCUM mode exposures over the course of each orbit.
|
Space Telescope Science Institute http://www.stsci.edu Voice: (410) 338-1082 help@stsci.edu |