|
| Cosmic Origins Spectrograph Instrument Handbook for Cycle 17 | ||||
|
|
4.1 The FUV XDL
4.1.1 XDL properties
The COS FUV detector is a windowless XDL (crossed delay line) device that is similar to detectors used on the Far Ultraviolet Spectroscopic Explorer (FUSE). The XDL is a photon counter with two segments, with a gap of 9 mm between them. The two detector segments are independently operable to provide redundancy. Each segment has an active area of 85 × 10 mm which is digitized to 16384 × 1024 pixels. The long dimension is in the direction of dispersion, and because of the orientation of the detector in COS, increasing pixel number (the detector's x axis) corresponds to decreasing wavelength. The XDL is shown schematically in Figure 4.3.
The locations of detected events are recorded in pixel units. However, the XDL does not have physical pixels in the usual sense, and the location of an event is determined by the analog electronics as they occur. This lack of pixels creates some uncertainty in the exact location of an event and can limit the achieved signal-to-noise for this reason.
The FUV XDL is optimized for the 1150 to 1775 Ĺ bandpass, with a cesium iodide photocathode. The front surface of the XDL is curved with a radius of 826 mm so as to match the curvature of the focal plane.
When photons strike the photocathode they produce photoelectrons which are then amplified by micro-channel plates. There are two stacks, each with three curved plates. An electron cascade typically produces a gain of 107, resulting in measurable charge clouds of 2 to 3 picocoulombs.
The XDL's quantum efficiency is improved with a grid of wires placed above the detector (i.e., in the light path). However, these wires create shadows in the spectrum that are removed during data reduction. The removal of these shadows is imperfect, leading to some systematic effects in the spectra.
The location of charge events is determined by delay lines. The charge cloud is several millimeters in diameter when it lands on the delay line anode. There is one such anode for each detector segment, and each anode has separate traces for the dispersion (x) and cross-dispersion (y) axes.
The electronics that create the digitized time signals also generate pulses which emulate counts located at the edges of the anode, beyond the illuminated regions of the detector. These "e-stims" have several purposes. First, they provide a first-order means of tracking and correcting distortions. They are also used for determining dead-time corrections.
The XDL includes an ion repeller grid. This reduces the background rate by preventing low-energy thermal ions from entering the open-faced detector. However, the grid wires also cast out-of-focus shadows onto the detector, and these shadows create structure in the recorded spectrum that is difficult to remove. At present, the achievable signal-to-noise with the FUV XDL detector appears to be about 30:1.
4.1.2 XDL spectrum response
Initial measurements of the throughputs of the COS optical systems indicate that COS will be considerably more sensitive than STIS and earlier generation HST instruments at comparable spectral resolutions. Current estimates for the end-to-end system throughputs of COS are shown in Figure 4.1. These estimates are appropriate for a point source centered in the COS primary science aperture (PSA). The throughput and effective area calculations include the throughput of the HST OTA and degradation of the light beam prior to entry into the COS instrumentation due to spherical aberration.
At FUV wavelengths, the peak throughput is 6.5% near 1300 Ĺ with the G130M grating. At NUV wavelengths, the peak throughput is 2.2% near 2350 Ĺ with the G225M grating. For comparison, similar calculations for several STIS MAMA spectroscopic modes covering the same ultraviolet wavelengths are also shown. At FUV wavelengths, the system throughput with the COS medium-resolution mode is at least a factor of 10 higher than for the STIS medium-resolution echelle mode (E140M), as shown by the vertical arrow, and is a factor of ~2 or more higher than for the STIS low-resolution mode (G140L), neglecting STIS slit transmission losses (which are typically 30% or more). At NUV wavelengths, the COS medium-resolution throughput is at least a factor of 2 higher than it is for the STIS medium-resolution echelle mode (E230M) and exceeds the throughput of the STIS low-resolution mode (G230L) below 2200 Ĺ.
The point source sensitivities (S
Figure 4.1: Throughputs for COS in the FUV and NUV. The effect of the HST OTA is included.) for the COS spectroscopic modes are shown in Sensitivity.
Also shown are data for STIS in comparable modes. The STIS throughputs do not include slit losses.
4.1.3 XDL read-out format
As noted, the FUV XDL "detector" actually consists of two separate and independent segments, each of which has an active area of 85 × 10 mm, with the long axis in the direction of dispersion. The physical devices have been butted, but that leaves a 9 mm gap between the active areas of the two segments. Although this gap prevents the recording of an uninterrupted spectrum, it also makes it possible to position spectra such that significant airglow features - Lyman-
in particular - fall on the gap. Without this feature, Lyman-
It is important to reiterate that the XDL devices do not have physical pixels in the way a CCD, say, does. Instead, a detected event gets assigned to a location in the (x, y) coordinates of the detector based on the delays in the signal that are detected. The XDL detectors are very fast and sensitive, but this method of recording an event carries with it an inherent uncertainty in the location. That uncertainty in location, in turn, limits the achieved signal-to-noise because it is not possible to obtain a flat-field exposure that precisely corresponds to the observed science spectrum.
Because of the orientation of the XDL detector within COS, the detector x axis is in the direction of dispersion, but the sense is opposite to that of the wavelength. In other words, increasing x in pixel space corresponds to decreasing wavelength. The detector y axis is in the cross-dispersion direction. The FUV XDL detector is shown schematically below.
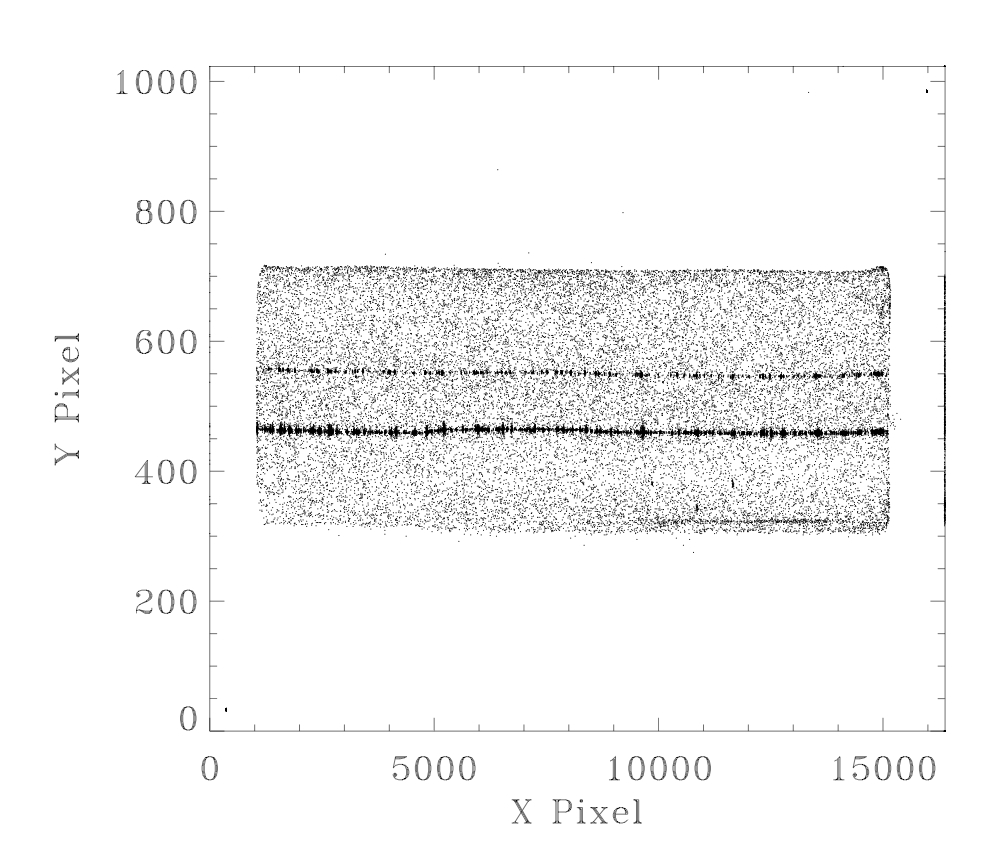
Below is shown an example of an FUV comparison spectrum obtained during ground testing. Note the difference in x and y axis scales.
Figure 4.2: Example of a COS FUV spectrum.
Shown is a comparison spectrum obtained during ground testing. Because of the test set-up, the comparison lamp fills both the WCA and the PSA, hence the two spectra.
Figure 4.3: The FUV XDL detector, shown schematically.
Note that wavelngth increases in the direction opposite to the detector coordinate system. The red dots show the approximate locations of the e-stims. The blue dot between the segments shows the origin of the detector coordinate system in y, so that y = 0 at the center.
4.1.4 Analog-to-digital conversion
As noted, each detected photon is assigned to a pixel. In
ACCUMmode, an area in the buffer at those coordinates is then incremented by one. At the end of anACCUMexposure, the buffer memory is read out and becomes an array of the detected photons across the detector.In
TIME-TAGmode, each photon is recorded as a separate event in a long list. Each entry in that list contains the (x, y) coordinates of the photon, together with the relative time it was detected. The time is binned into 32 msec increments, but more than one event can be recorded within a single 32 msec time interval.The dead time associated with the detection electronics of the XDL detector is 7.4 µsec. For more on non-linear effects, see Non-linear photon counting effects (dead-time correction).
4.1.5 Stim pulses (e-stims)
The signals from the XDL anodes are processed by Time-to-Digital converters (TDCs). Each TDC contains a circuit which produces two alternating, periodic, negative polarity, tailed pulses which are capacitively coupled to both ends of the delay line anode. When active, these e-stims emulate counts located at the edges of the anode, beyond the illuminated portions of the detector. These e-stims are useful in several ways. Some of those ways have to do with calibrations and monitoring the instrument, but for observers they provide a means to track changes in image shift and stretch during an exposure and provide a first-order check on the dead-time correction.
Four e-stim rates are available: 0, 2, 30, and 2000 Hz. Exposures longer than 100 sec will use the 2 Hz rate, while exposures from 10 to 100 sec will use 30 Hz. The highest rate is only for calibration.
4.1.6 Pulse-height distributions
The XDL detector will generate pulse-height distributions (PHDs) along with the science data. The PHD provides important information on the micro-channel plate. It measures the gain of the MCP electron amplification. The distribution of the pulse heights of photon events is peaked at the average gain of the MCPs with a width determined by MCP characteristics. Background events, both internal and cosmic-ray-induced, tend to have a falling exponential distribution in pulse height, with most events being at very low pulse heights. On-board charge threshold discriminators are used to preferentially filter out very large and small pulses to improve the achieved signal-to-noise.
4.1.7 FUV detector lifetime adjustments
The FUV XDL detector is subject to gradual charge depletion over its lifetime which reduces its sensitivity. The effect is small, but can be localized by, for example, geocoronal Lyman-
|
Space Telescope Science Institute http://www.stsci.edu Voice: (410) 338-1082 help@stsci.edu |