|
| Cosmic Origins Spectrograph Instrument Handbook for Cycle 17 | ||||
|
|
3.2 COS' Capabilities
COS was built for speed and was not intended as a general-purpose spectrograph. Nevertheless, COS is very powerful and can be applied to many scientific investigations. COS' single most critical criterion is that it is designed to observe point sources (objects less that 0.1 arcsec in diameter). There may be applications to extended or structured sources, but in general at a significant cost in the resolution or purity of the spectrum. With only a few exceptions, this document is written for point-source observing, with the intent of adding information on other uses once we can assess them after launch.
COS has two channels, one for the Far Ultraviolet (FUV), and one for the Near Ultraviolet (NUV). Both channels use photon-counting detectors, but those detectors are very different, and in many other ways as well the two channels of COS are used in substantially different ways. Both channels also offer a selection of diffraction gratings that you may use to choose either medium- or low resolving power, with good throughput at any ultraviolet wavelength.
Table 3.1: COS Spectroscopic Modes
Table 1:
(Ĺ resel-1)
1The useful wavelength range is the expected usable range realized in each grating mode. Note that G140L is set so that Lyman- falls in the gap between the two micro-channel plates to minimize the effects of geocoronal glow. With G140L, one half records 1230 - 2050 Ĺ. The other half records whatever spectrum is detected below 1100 Ĺ, but that is expected to be very little in most cases, hence the 820 Ĺ nominal bandpass.
2The lesser value of R is realized for the low-wavelength end of the useful range, and R increases roughly linearly with wavelength.
COS also incorporates a very limited imaging capability in its NUV channel. This is primarily useful for acquisitions, and is described in that chapter (see Chapter 6 on page 77).
3.2.1 Signal-to-noise considerations
The COS FUV channel will be capable of routinely delivering fully reduced spectra with a signal-to-noise (S/N) ratio of ~30 per resolution element in single exposures at specific grating settings, given sufficient detected photons, of course. Higher S/N ratios may be attainable, depending on the quality of the flat-field images obtained as part of the instrument calibration program. In addition, COS FUV science exposures can be obtained at slightly different focal plane positions in the dispersion direction. Alignment and co-addition of these "
FP-POS" sub-exposures should further reduce the effects of fixed-pattern noise in the final calibrated spectrum. A full quantitative assessment of the fixed-pattern noise present in COS spectra and the potential for removal in the calibration process must await on-orbit calibration of the instrument.In the NUV channel, we expect to achieve S/N comparable to what has been possible with STIS, namely 100:1 or better.
3.2.2 Photometric (flux) precision
The limits on the precision and accuracy of fluxes measured with COS are the same as for STIS. COS does have the advantage of a fairly large aperture so that there are no slit losses. The capabilities of COS will be tested after it is installed, but for now we take them to be the same as STIS, namely 5% accuracy on absolute fluxes and 2% on relative fluxes (within a single exposure). Repeated exposures of the same target at the same setting should deliver the 2% accuracy as well.
3.2.3 Wavelength accuracy
The COS specifications for absolute wavelength uncertainties within an exposure are:
- 15 km s-1 for medium-resolution spectra (the "M" gratings),
- 150 km s-1 for G140L, and
- 175 km s-1 for G230L.
The error budget for the various gratings then breaks down as shown in the following table. Note that all quantities are 1
. To arrive at the last two columns, the error budget has been divided equally between internal and external sources. The internal sources include the accuracy of the wavelength scale, the dispersion relation, aperture offsets, distortions, and drifts. The external error is due to target mis-centering in the aperture.
Table 3.2: Wavelength calibration uncertainties The quantities shown are 1
Table 3.3:
G130M G160M G140L G185M G225M G285M G230L
Observers need to be aware that tests of COS on the ground before flight showed some motion of the grating carrousel after it was stopped at its nominal position. This drift is small but significant enough for the first few minutes to potentially degrade a spectrum in wavelength. It is to properly calibrate this effect that the "
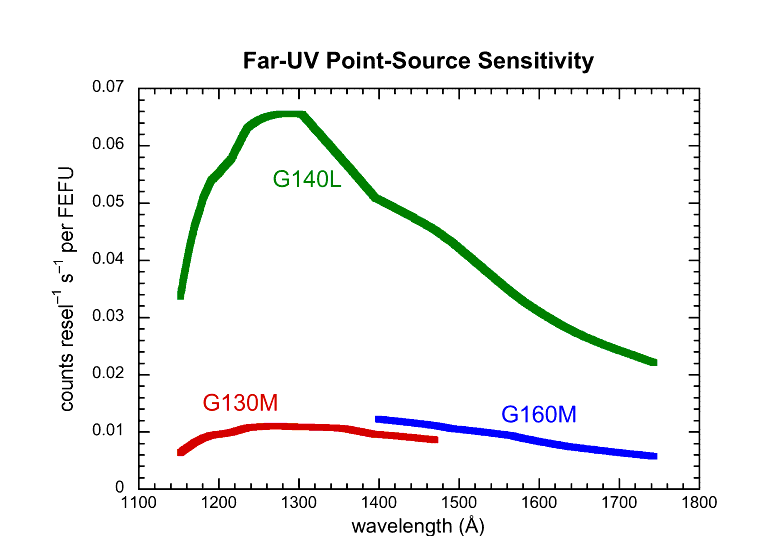
Figure 3.4: Far-ultraviolet sensitivity curves for COS.TAG-FLASH" operating mode was designed.TAG-FLASHmode means usingTIME-TAGobservations withFLASH=YES(the default), and in this mode the wavelength calibration lamp is exposed periodically during science observations so that any drift can later be removed. Because the wavelength calibration spectra are recorded on the photocathode well away from the science spectrum, one does not contaminate the other.TAG-FLASHis described further in Chapter 8 on page 101.
The values shown are counts per resel per unit FEFU, and are for point sources. Please note that these data are plotted for display purposes only and that those planning observations should use the ETC to get accurate estimates.
3.2.4 Sensitivity
Measurements of the throughputs of the COS optical systems indicate that COS will be considerably more sensitive than STIS and earlier generation HST instruments at comparable spectral resolutions. Preliminary results for the end-to-end system throughputs of the COS FUV and NUV channels are shown in Chapter 4. These estimates are appropriate for a point source centered in the COS primary science aperture (PSA). The throughput and effective area calculations include the throughput of the HST OTA and degradation of the light beam prior to entry into the COS instrumentation, as described by Burrows (1988, STScI internal memo).
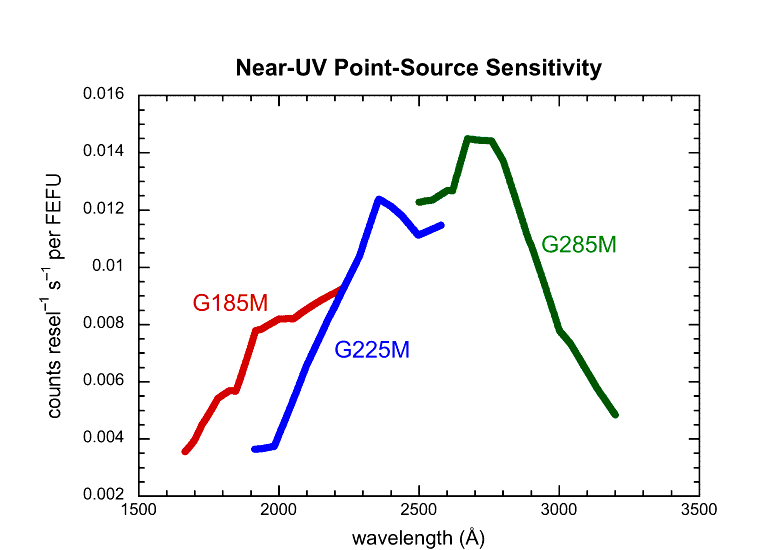
Figure 3.5: Near-ultraviolet sensitivity curves for COS.
The values shown are in counts per resel per unit FEFU, and are for point sources.
The point source sensitivities (S
) for the COS spectroscopic modes are shown above. An estimate of the number of counts (N) expected per resolution element in an amount of time (
t) for a source flux (F
10 FEFU. The same exposure with the STIS E140M mode and the 0.2 × 0.2 arcsec aperture (binned by a factor of 2.3 to a resolution R ~ 20,000) would take approximately 170,000 seconds after accounting for the STIS scattered-light backgrounds and slit losses. All COS sensitivity estimates shown are drawn from COS Thermal-Vacuum ground testing; updates based upon on-orbit measurements will be made during SMOV period and Cycle 17.
3.2.5 Non-linear photon counting effects (dead-time correction)
The electronics that handle the COS detectors have a finite response time, and that limits the rate at which they can detect photons. This effect of non-linearity is sometimes known as the dead-time correction.
The effect has been measured for the FUV XDL detector, with a dead-time constant of 7.4 µsec. For a given true count rate C, the detected count rate is given by:
where D is the detected count rate and t is the dead-time constant. For the value of t given (7.4 µsec), the apparent count rate deviates from the true count rate by 1% when C = 1,350 counts sec-1, and by 10% when C = 13,500 counts sec-1. Note that when the effect is near the 10% level that the FUV detector is near its global count rate limit (see Section 7.2, "Safety First: Bright Object Protection," on page 84) and so non-linear effects are small for the FUV detector.
There is an additional non-linear effect in the FUV channel that has not yet been quantified. A single "round robin" Detector Interface Board (DIB) takes signals from both the A and B segments and then stores them in the data buffer. The DIB interrogates the A and B segments alternately, and, because of this, a high count rate in one segment but not the other could lead to an additional effect. The DIB is limited to processing about 250,000 events sec-1 in ACCUM mode and only 21,000 counts sec-1 in TIME-TAG mode.
For the NUV MAMA on COS, the dead-time has not been measured and will be calibrated on-orbit. Note, however, that for the STIS MAMAs the 10% level of non-linearity is reached for C = 300,000 counts sec-1, well above the safe global count rate limit and so not of concern. The MAMAs also show a local non-linear effect that is small and will be calibrated on orbit.
|
Space Telescope Science Institute http://www.stsci.edu Voice: (410) 338-1082 help@stsci.edu |