9.6 Exposure-Time Examples
In the following you will find a set of examples for the three different channels and for different types of sources. The examples were chosen in order to present typical objects for the three channels and also to present interesting cases as they may arise with the use of ACS.
9.6.1 Example 1: WFC Imaging a Faint Point Source
What is the exposure time needed to obtain a signal-to-noise of 10 for a point source of spectral type F2 V, normalized to V = 26.5, when using the WFC, F555W filter? Assume a GAIN of 1 and a photometry box size of 11 x 11 pixels, and average sky values.
The ACS Exposure Time Calculator (ETC) gives a total exposure time of 4410 seconds to obtain this S/N in a single exposure. Since such an exposure would be riddled with cosmic rays and essentially useless, it is necessary to specify how many exposures to split the observation into. ACS WFC observations generally should be split if the exposure time is larger than about 5 minutes, but for multi-orbit observations, splitting into 2 exposures per orbit is generally sufficient.
For a typical object visibility of 53 minutes, after applying the requisite overheads, there is time for two 1200 seconds exposures per orbit. The required exposure time can thus be reached in 4 exposures, but re-running the ETC using CR-SPLIT=4 raises the required exposure time to 5303 seconds (because of the extra noise introduced by the four extra readouts). To achieve the required exposure time would require CR-SPLIT=5, or three orbits.
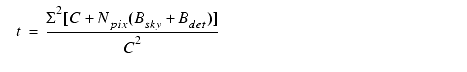
Using the pencil and paper method, Table 9.1 gives the integral QTdl/l as 0.0775, and the ABn correction term can be retrieved from Table 10.1 as 0.040. According to Figure 5.9, a circular aperture of radius 0.3 arcseconds (which has an area of 116 pixels, close to the 121 pixel box specified) encloses about 90% of the light from a star. The count rate is then 2.5x1011*0.0775*0.9*10-0.4(26.5+0.040) = 0.423 counts/second, which agrees with the ETC-returned value of 0.42. The exposure time can then be found by using the equation
to give t = 4172 seconds, which is close to the ETC-derived value of 4410 seconds. We have inserted the background rate from Table 9.1 (Bsky = 0.055) and Table 9.5 (Bdet = 0.0032), and assumed that the noise on the background is much greater than the readout noise.
Note that this can be greatly shortened by specifying a smaller analysis box (for example, 5 x 5) and using LOW-SKY. Dropping the aperture size to 5 x 5 at average sky which still encloses 81% of the light requires 1532 seconds. Including both the smaller 5 x 5 box and LOW-SKY (Zodiacal = LOW, Earthshine = AVERAGE), using the ETC gives the required exposure time as only 1306 seconds (using CR-SPLIT=1), or 1540 seconds with CR-SPLIT=2. The LOW-SKY visibility per orbit is 47 minutes, which allows a total on-target exposure time of 2000 seconds in one orbit with CR-SPLIT=2.
Note also that the count rate from WFPC2 would be 0.167 electrons/second, a factor of 2.5 lower.
9.6.2 Example 2: SBC Objective Prism Spectrum of a UV Spectrophotometric Standard Star
What is the peak count rate using the PR110L prism in the SBC for the HST standard star HS2027+0651 (V = 16.9) that was used for the STIS prism calibration (this spectrum is not in the ETC list, therefore we quote below the flux which could be found by dearchiving the STIS spectrum)?
The sensitivity peaks in the 1500 Å to 1600 Å region. To find the count rate at 1537 Å, inspection of Figure 6.22 gives the sensitivity of 9.9x10¹⁴ counts/second per erg/cm2/s/Å. Multiplying by the stellar flux of 5.3587x10⁻¹⁴ gives 53.0 counts/second, summed in the cross dispersion direction. For the fraction of light in the central pixel e = 0.31, the brightest pixel at 1437.6 Å is 17.6 counts/second/pixel, well below the bright object limit.
The SBC has no readout noise, and the dark current rate is negligible, while the main sky contribution for PR110L is from Lyman-a. For daytime Ly-a intensity of 20kR = 6.1x10⁻¹³ ergs/cm2/second/arcseconds2, S¢ = 1.7x10¹⁴, and d, the dispersion in Å/pixel, is 2.58. Therefore, the background count rate is 6.1x10-13*1.7x1014*0.0322/2.58 = 0.041 counts/second/pixel. This value varies somewhat over the field, as the plate scale varies from the nominal 0.032 arcseconds/pixel. For faint source spectroscopy, it is better to use PR130L, which is on a CaF2 substrate to block Ly-a.
9.6.3 Example 3: WFC VIS Polarimetry of the Jet of M87
What signal-to-noise ratio is reached in three one orbit exposures (~2400 seconds each) for M87, when using the WFC, F555W for one orbit each in the three VIS polarizers? Gain is 2, box size is 5 x 5 pixels, CR-SPLIT=2, and average sky.
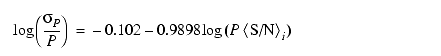
If the M87 jet region has mV = 17 magnitudes/arcseconds2, using the ETC with a flat continuum spectral distribution and an exposure time of 2400 seconds (CR-SPLIT=2), gives S/N = 131.6 for an observation with each VIS polarizer filter (which is an average of the polarizer at the 3 available position angles 0×, 60×, and 120×). If the polarization P is 20%, then P*S/N = 26.3, so using
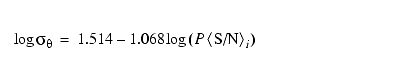
from Chapter 6, sP/P = 0.031, or sP = 6.2x10⁻³, which is the error on the fractional polarization. The error on the position angle should be ~1.0×using the formula, again from Chapter 6, of
9.6.4 Example 4: SBC imaging of Jupiter’s Aurora at Lyman-alpha
What signal-to-noise ratio is reached in a one orbit exposure (2000 seconds) observing Jupiter’s aurora in Ly-a using the SBC and F122M filter?
The equation from the Section , "Emission Line Source," on page 183 can be used to calculate the expected count rate. The aurora is variable, up to ~100kR. The value of (QT) for the SBC+F122M filter at 1216 Å is 0.0009, from inspection of Figure 10.106 on page 238. For a surface brightness of 40kR = 1.22x10⁻¹² erg/cm2/second/arcseconds2 (See Heading & Page for conversion), the total counts per pixel are given by the following calculation:
2.23x101 2* 0.009 * 1.22x10-12 * 1216 * (0.032)2 * 2000 = 61.0.
The background contributions are the detector dark of 1.2x10⁻⁵ counts/pixel/second (which can be ignored in this case) and a sky background which is dominated by geocoronal Lyman-a. During the daytime, the geocoronal background is 20kR, or 30.5 counts, while at night the background drops to one tenth of this, or 3.05 counts.
Finally, we calculate the signal-to-noise ratio S for a 2 x 2 pixel resolution element: in the daytime,
= 12.7, while at night,
= 15.2
9.6.5 Example 5: Coronagraphic imaging of the Beta-Pictoris Disk
In the final example we shall consider the case where we are trying to determine the S/N achieved on the Beta Pictoris disk, assuming a disk surface brightness of R magnitude of 16 arcseconds2 at a distance of 6 arcseconds from the central star with a V magnitude of 3.9, for an exposure time of 1000 seconds with an F435W filter. Assume that the star and disk have an A5 V-type spectrum. Using the ACS Exposure Time Calculator and considering the case for the 3.0 arcseconds occulting mask:
- Disk count rate = 4.98 e-/second for a 2 x 2 aperture (including 47.5% throughput of coronagraph) Sky count rate = 0.010 e-/second/pixel, Detector dark rate = 0.015 e-/second/pixel
- In 1000 seconds, this gives 4,980 e-/2 x 2 aperture in the disk region.
- Central star count rate = 3.63x10⁸ e-/second for a 101 x 101 aperture (101 x 101 aperture used to estimate total integrated flux)
- At a distance 6 arcseconds from the central star, the fraction of flux per square arcsecond in the PSF wings is 2.6 x 10⁻⁶.
BPSF = 3.63 x 1011 * 2.6x10-6 = 943.8 e- per square arcsecond. The counts collected in 4 pixels are 4 x 0.0272 x (943.8 = 2.752.- The S/N in a 2 x 2 box is then
.
|
Space telescope Science Institute http://www.stsci.edu |