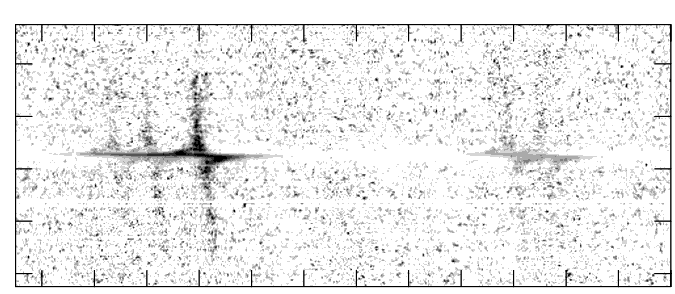


STIS first-order mode long-slit spectroscopy has a wide observing range from the near IR through the optical and into the ultraviolet. Figure 4.7 shows an early STIS result measuring the black hole mass in the nucleus of a nearby galaxy.
Figure 4.7: Greyscale Representation of STIS G750M 52X0.2 Long-Slit Spectrum of the nuclear region of M84, showing the velocity structure of the H , [NII], and [SII] emission lines in the inner gaseous disk. The continuum has been subtracted from the data and they have been renormalized. (Figure courtesy of Gary Bower and Richard Green, see also Bower et al. 1998, ApJ, 492, L111).
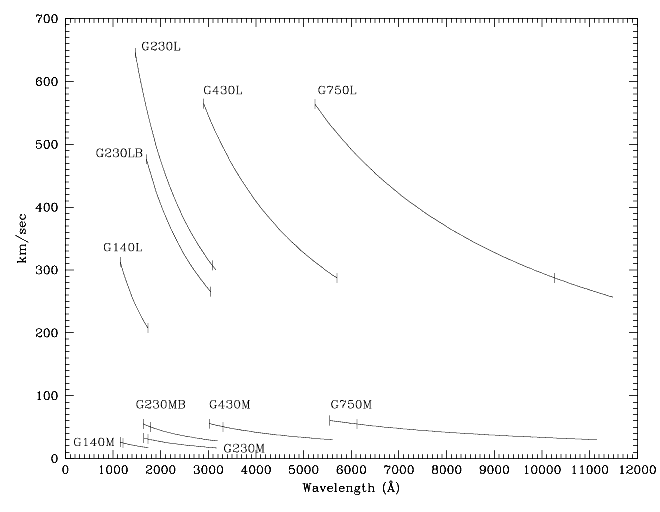
There are 10 first-order gratings available for long-slit spectroscopy, providing resolving powers of ~500-17,000 from the UV at 1150 Å through the near IR at ~ 10,000 Å. The wavelength coverage and kinematic resolution of the first-order gratings are summarized in Figure 4.8. Briefly:
Figure 4.8: Wavelength Coverage Versus Kinematic Resolution of First-Order Modes. The hatches indicate the wavelength coverage at a single scan setting.
Supported for use with the first-order gratings are long slits of widths 0.05, 0.1, 0.2, 0.5 and 2.0 arcseconds (in the dispersion direction), and lengths of 52 arcseconds (as projected on the CCD detector) or 25 arcseconds (as projected on the MAMA detectors) for the MAMA low-resolution, first-order gratings (G230L and G140L) and 28 arcseconds for the MAMA intermediate-resolution, first-order gratings (G230M and G140M).1 Note that the 0.1 arcsecond width matches the 2 pixel resolution of the CCD, while the 0.05 arcsecond width does so for the MAMAs, providing maximum spectral resolution. The 0.2 arcsecond-wide slit is the general utility slit used most often; it provides a good compromise between resolution and throughput. Programs requiring accurate absorption-line measurements in continuum sources should always use slits of widths  0.2 arcsecond, since for larger apertures the spectral purity is significantly degraded by the telescope plus instrumental Point-Spread Function (PSF); see Section 13.7. Finally, we expect the wider 0.5 and 2.0 arcsecond slits to be used predominantly in photon-starved ultraviolet observations of extended sources, but provide them for use in the optical as well to assure that line-ratio studies with coverage from the ultraviolet to the optical can sample the same physical region on the sky. Additionally, they are the most photometric slits as their throughput is least affected by centering and telescope breathing. Of course, observations of extended sources with wide slits will have correspondingly degraded spectral resolutions.
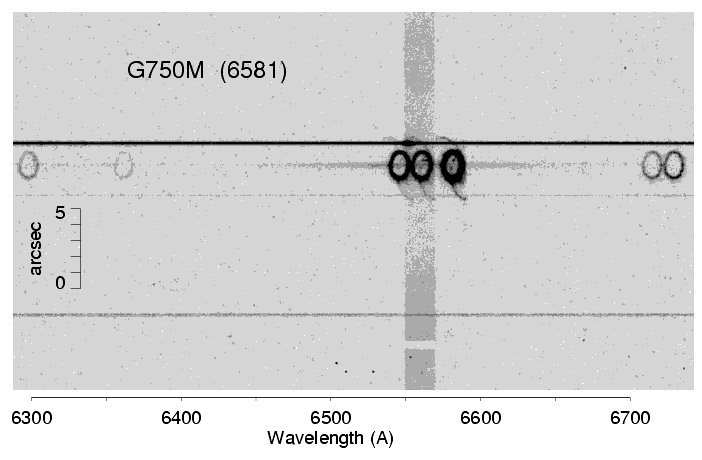
The first-order gratings can also be used "slitless" to obtain two-dimensional spectra of targets, or pseudo "images." Slitless spectroscopic data will not be fully calibrated by the STScI pipeline, and it will require directed post-observation data processing by the user, as ambiguous overlap of wavelengths from different parts of sources can occur in the image (see Section 12.1). Figure 4.9 shows an example of the use of the 52X2 slit with the G750M grating to obtain such a series of emission line images of SN1987A.
 , [NII], and [SII]. Diffuse H
 emission from the LMC fills the 52X2 arcsecond slit, and broad H
 emission from the SN is also visible. The continua of stars produce the horizontal bands. The image shown is a 950 x 450 subsection of the 1024 x 1024 image. (Figure courtesy of Jason Pun and George Sonneborn, see also Sonneborn et al. 1998, ApJ, 492, L139).
Note that for the FUV-MAMA first-order modes, the projection of the spectrum on the detector has deliberately been shifted 120 low-resolution pixels or 3 arcseconds below center (3 arcseconds above center prior to March 15, 1999) to avoid having the spectrum fall on the shadow of the repeller wire (see also Section 7.5 and Section 11.1.2). This shift applies to all data taken with the G140L and G140M gratings, regardless of the aperture used.
Note also the MAMA monthly offsetting which can additionally shift the projection of the spectrum on the detector by ~ ±80 low-resolution AXIS2 pixels in a given month. This latter shifting applies to all first-order MAMA modes (see Section 11.1.2).
The properties of each of the first-order gratings are described in detail, grating by grating, in Chapter 13; see the second-to-last column of Table 4.1 for easy reference to the appropriate page for each grating.
The detailed properties of the long slits (e.g., throughputs and line spread as functions of wavelength), plate scales, and encircled energies for the first-order gratings are presented under Section 13.4, Section 13.5, and Section 13.6.
1The MAMA first-order modes have varying spatial plate scales; see Chapter 13.

|
Space Telescope Science Institute http://www.stsci.edu Voice: (410) 338-1082 help@stsci.edu |