

The so-called "long vs. short" anomaly is a nonlinearity of WFPC2 which causes the recorded count rate to increase with exposure time for a given source - the source thus appears brighter in a long exposure than in a short exposure. Suggestions of this nonlinearity was first discussed by Stetson (1995) and then examined in more detail by Kelson et al. (1996), Saha et al. (1996), and Casertano & Mutchler (1998). More recent studies, however, have disputed the existence of the "long vs. short" problem (e.g., Dolphin 2000). Casertano & Mutchler (1998), Hill et al. (1998), and Dolphin (2000) suggest that the apparent "long vs. short" anomaly may be caused by overestimating the value of the sky by a few electrons in the shorter exposure.
We reexamined the "long vs. short" anomaly (Whitmore & Heyer 2002) using the same dataset as in Casertano & Mutchler (1998), that of the globular cluster NGC 2419 taken in 1997 (Proposal 7619). We have analyzed the stars on two chips, WF2 where the globular cluster was centered and WF4 where the stars are much less densely packed. Note that only chip WF2 was analyzed in Casertano & Mutchler (1998). For the uncrowded field (less than ~1000 stars per chip), the typical values of the "long vs. short" nonlinearity are small (a few percent) or nonexistent for stars in the range of 2-400 DN (i.e. 15-3000 electrons) as measured on the "short" exposure. We do not find the larger values (i.e. tens of percent) predicted by Casertano & Mutchler (1998). A re-analysis of WF2 with its densely-packed star field (~10,000 stars per chip) also indicates, in general, a smaller correction than Casertano & Mutchler. Although very large values of a "long vs. short" anomaly are possible for very faint stars in very crowded fields, it appears that the Casertano & Mutchler formula was tuned to fit the worst cases and, therefore, overestimates the values for more typical cases.
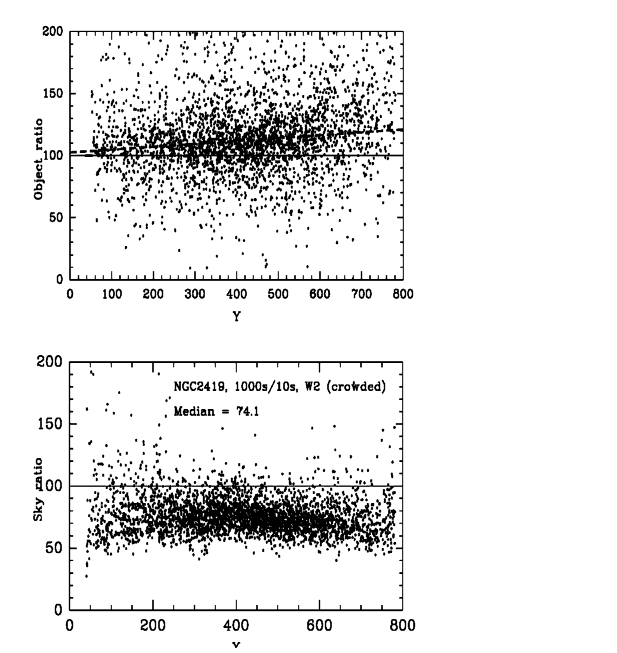
We conclude that the "long vs. short" anomaly is very small or non-existent for relatively uncrowded fields (e.g., less than ~1000 stars per chip). However, we still find evidence for varying levels of a "long vs. short" nonlinearity associated with crowded fields, probably due to the subsequent difficulty of estimating accurately the sky background. In order to investigate this possibility further, we separated the measurement of the local sky and the measurement of the object for the crowded NGC 2419 field (WF2). The top panel of Figure 4.22 shows the ratio of the counts in the object aperture of the 1000 sec. exposure relative to the counts in the 10 sec. exposure, using constant values of the sky equal to 30 DN for the long exposure and 0.30 DN for the short exposure. The dashed lines shows the linear fit to the data, with a slope due to the normal CTE effect. The intercept at Y=0 is within ~2 sigma of the theoretical value of 100. Hence, there appears to be little or no "long vs. short" problem for the ratio of the object observations. However, the ratio of the sky values (bottom panel of Figure 4.22:) shows an obvious tendency to fall below the theoretical value of 100. This appears to be the cause of the "long vs. short" anomaly in the crowded NGC 2419 field. The sky values in the 10 sec. exposure appear to be overestimated by about 35%, relative to the predicted values based on the sky measurement of the 1000 sec. exposure. This overestimate of the sky background is enough to produce the large effect observed by Casertano & Mutchler (see Whitmore & Heyer 2002).
Because the sky measurement appears to be the cause of the apparent "long vs. short" anomaly, the magnitude of this effect is highly dependent both on the level of crowding in the image and on the specific reduction parameters (e.g., aperture size) used by the observer. Consequently, we do not provide any set formula to correct this effect. The user is referred to Whitmore & Heyer (2002) for more details on this apparent anomaly and for some possible recommendations for dealing with the most adversely affected datasets.
Figure 4.22: The ratios of the counts in the 1000 sec. exposure to the counts in the 10 sec. exposure for the crowded NGC 2419 field. The top panel shows the ratios in the object apertures using a constant sky value of 0.3 DN for the short exposure and 30 DN for the long exposure. The dashed lines shows the linear fit to the data, with a slope due to the normal CTE effect. The intercept at Y=0 is 102.6 +/- 1.2, within ~2 sigma of the theoretical value of 100. The bottom panel shows the ratio for the local sky measurements. The sky ratio is well below the predicted value of 100, with a median value of 74.1 (mean = 75.9 +/- 0.6). This result implies that the "long vs. short" effect is caused by sky measurements rather than object measurements.


|
Space Telescope Science Institute http://www.stsci.edu Voice: (410) 338-1082 help@stsci.edu |