|
| Space Telescope Imaging Spectrograph Instrument Handbook for Cycle 14 | |||||
|
| ||||||
Echelle Grating E230M
Description
The
E230Mgrating is used with theNUV-MAMAand provides echelle spectra at a resolving power of 30,000 from 1570 to 3100 Ĺ.Special Considerations
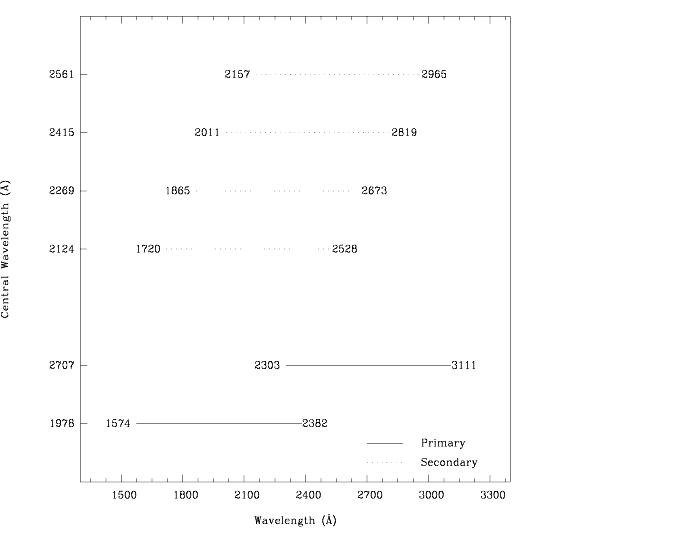
A single exposure with this grating covers 800 Ĺ over ~20-40 orders. The interorder separation is ~18 pixels (0.52 arcseconds) at 1650 Ĺ and 62.5 pixels (~1.8 arcseconds) at 3100 Ĺ. The grating must be scanned, with exposures taken at two distinct settings to cover the full spectral range of the grating.
Figure 13.46: Wavelength Ranges for the E230M Grating Settings
E230M Sensitivities
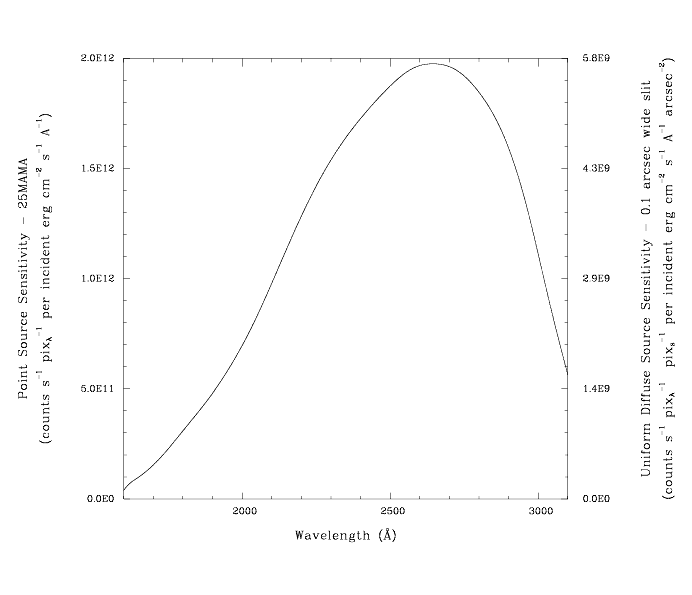
Table 13.13: E230M Throughputs & Sensitivities for a Point Source
Figure 13.47: E230M Point Source (left axis), and Diffuse Source (right axis) Sensitivities. Throughput curve traces the peaks of the blaze function for each order.
Note
Point source sensitivity assumes full transmission (zero slit losses). Diffuse source sensitivity assumes a 0.1" wide slit. To convert point source sensitivities to diffuse source sensitivities multiply the point source values by the grating spatial (cross dispersion) plate scale in units of arcseconds per pixel and by the width of the desired slit in units of arcseconds.
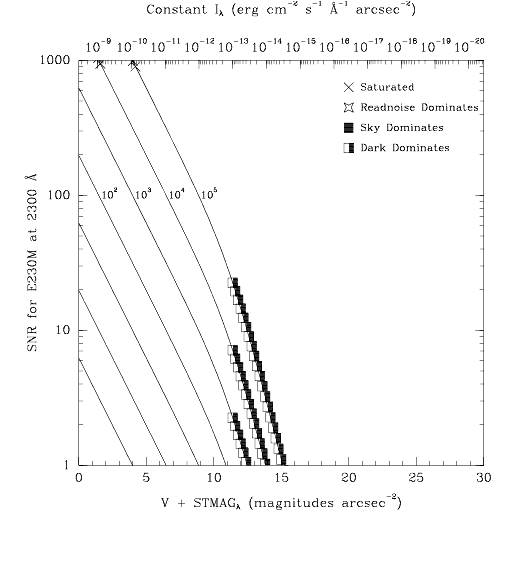
E230M Signal-to-Noise
Note:
The top axis displays constant F
Figure 13.48: Diffuse Source Signal-to-Noise as a function of STMAG for E230Mvalues corresponding to the STMAG units (V+STMAG
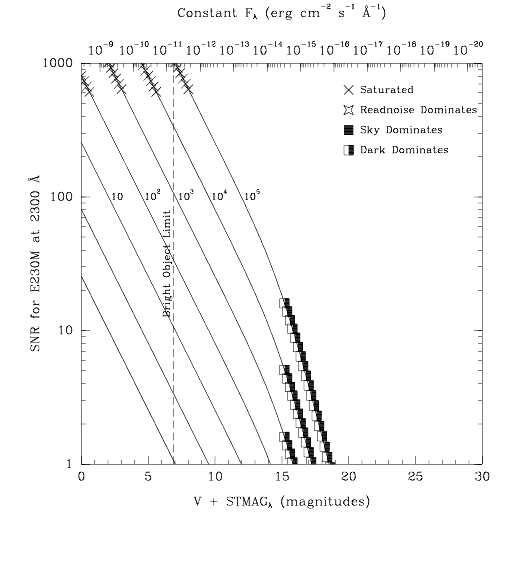
Figure 13.49: Point Source Signal-to-Noise as a Function of STMAG for E230M
|
|
|||||
|
Space Telescope Science Institute http://www.stsci.edu Voice: (410) 338-1082 help@stsci.edu |